Gold Market Update


On longer-term charts gold looks great here as it accelerates away from its recently completed 20-month consolidation pattern. The prospect is for a powerful, steep multi-month advance, punctuated by mostly brief periods of consolidation. In the last update we examined the long-term charts to divine the big picture and as this has not changed since, we will in this update look at the shorter-term charts to consider the immediate outlook as gold is now overbought, and also pay attention to the dollar and euro, which are on the cusp of big moves that obviously have important implications for all markets.
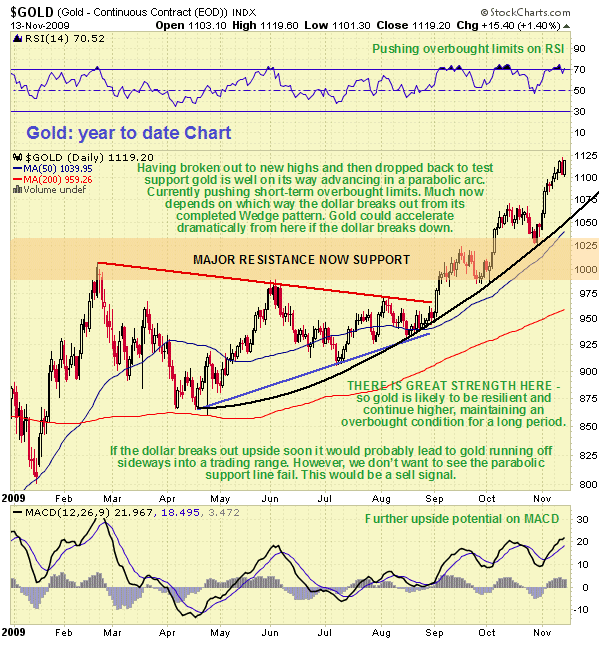
The year-to-date chart for gold looks extraordinarily bullish. It shows how gold is now accelerating away from the recently completed major consolidation pattern, with the early October breakout being followed by a classic test of support late in October. Since we are looking for - and expect to see - a parabolic acceleration away from the "gravitional pull" of the huge trading range, it is particularly satisfying to be able to draw a parabolic arc on this chart which already has three exact contacts. This parabolic arc is clearly of the utmost importance - gold is an automatic buy on any contact with it, and failure of this arcing trendline will be a sell signal. Gold ran into a little bit of trouble late last week which was hardly surprising as it had become critically overbought on its RSI indicator shown at the top of the chart, however, there is still considerable room for it to advance further and continue to accelerate as made plain by the MACD indicator at the bottom of the chart, which is only moderately overbought. It is important here to point out that in the dynamic advancing phase, which gold is now in, it can BECOME OVERBOUGHT AND STAY OVERBOUGHT PERHAPS FOR MONTHS ON END, with minor reactions to ease overheating.
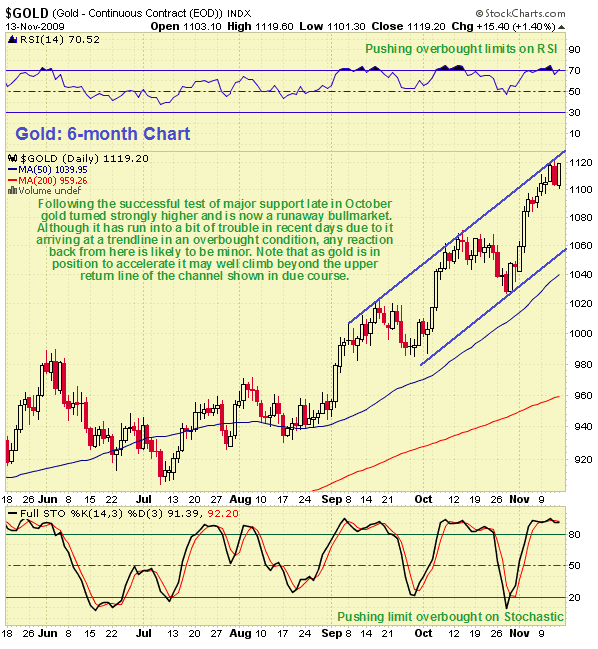
The 6-month chart makes clear why gold reacted back sharply last Thursday. It had arrived at the return line of the channel shown in a short-term critically overbought state, calling for consolidation/reaction to ease the overbought condition. However, Friday's robust recovery is a strongly bullish indication, so any further reaction is likely to be minor. The channel shown is provisional and given that gold has the potential to continue to accelerate, we should not be surprised to see it break above the top line of the channel shown in due course, once it is less overbought.
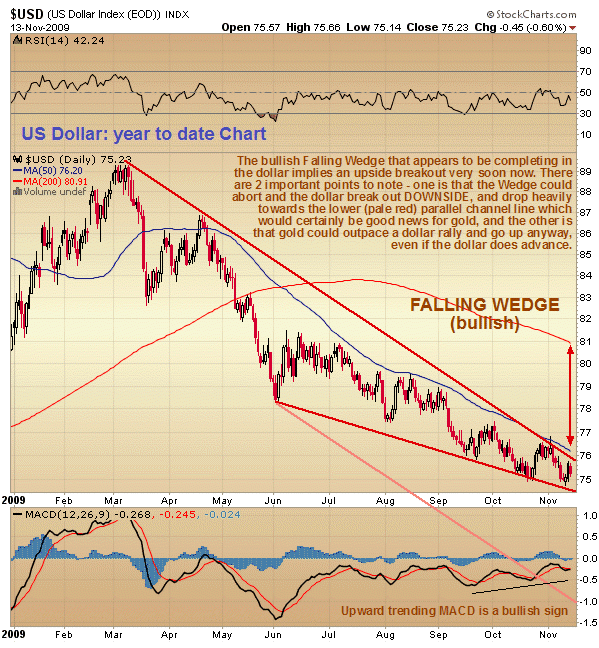
With the course of the dollar having major implications for gold and silver, and indeed all markets, it is timely for us to take look at it here, as it appears to be on the cusp of a big move. On the year-to-date chart for the dollar we can see that it is pushing towards the apex of a large Falling Wedge pattern. Normally Falling Wedge patterns are bullish but in the case of the dollar we do not have sufficient contacts with its boundary trendlines, particularly the top trendline, that we can be very sure of an upside breakout - it could BREAK DOWN instead and drop, possibly precipitously, towards the pale red parallel return line shown. If this happens we are looking at a massive drop that would stoke an enormous runup in gold, which as we have just seen, it is in position to make. One thing is for sure though, and that is that the dollar is on the verge of a more rapid move than we have seen for many months. A situation like this, where it is very difficult to divine in advance the direction of breakout, is usually due to the market waiting on some completely unpredictable "black swan" event. Some gold bulls and goldbugs have understandably been rattled by the dire predictions of market forecasters like Karl Denninger and Ronald Rosen, who are in effect predicting a deflationary implosion, and soon. They may well be right if the "recovery" engineered by the powers that be via an orgy of manufactured liquidity and rock bottom interest rates is derailed by factors beyond their control, but it is very hard to determine if this will happen immediately, or in 6 months or in 2 years' time or at all - maybe the Asian tiger economies will ride to the rescue of the entire world. In the meantime, however, we could see a period of robust inflation that continues to drive up the price of gold and silver and many other commodities. We don't need to expend valuable cerebral energy trying to figure out the answer to this riddle ahead of time, however, because as pragmatic traders we simply continue to ride gold's parabolic uptrend, garnering huge profits along the way, and we only need to consider hitting the exits should it fail. A tragic irony is that many Precious Metal stock investors will miss out on the developing huge rally in the sector, due to having been burned to a crisp during last year's meltdown, which has left them either wiped out or psychologically in no fit state to play the game. They are so spooked by the prospect of another broad market meltdown dragging everything down the hole that they are going to sit and watch the whole show from the sidelines, probably entering belatedly at much higher levels. Their fears are perfectly understandable - there could be another such meltdown, but the difference between them and us is that we are in the game and comfortable with it, because we have our predetermined point at which to hit the exits if the wheel comes off.
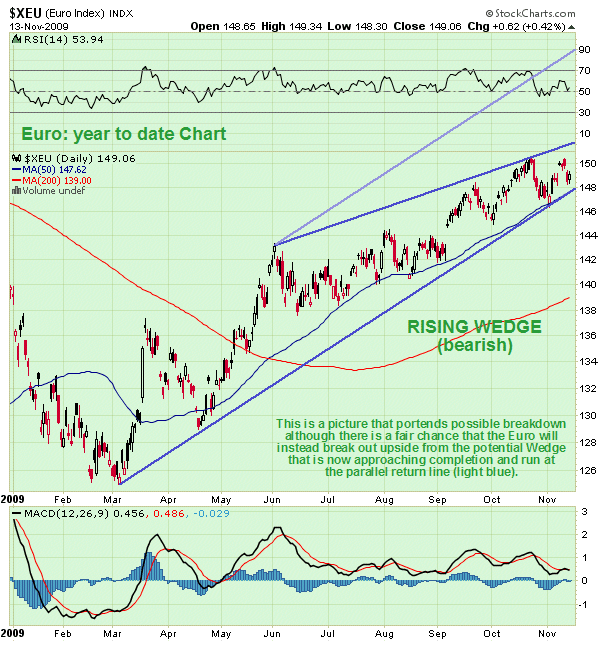
The dollar's Falling Wedge pattern is neatly reflected by the Rising Wedge pattern in the euro, which is precisely what we would expect to see. It has to be said that the euro does look like it is running out of puff on this chart. However, like the dollar, it could instead break out upside and run at the pale blue parallel return line shown.
Even if the dollar does break out upside and the euro to the downside, it does not automatically mean that gold and silver are going to get crushed, although it obviously doesn't help. In the changing world we live in we could find ourselves in a situation where the dollar and gold rally at the same time, in other words gold's rate of advance exceeds that of the dollar, so that it outruns it. Whatever the dollar does however we are clear - we can safely remain long gold whilst it remains above its parabolic uptrend line, only if it breaks below it will we need to consider evasive action.
The performance of silver this year relative to gold has been paradoxical - on the one hand it has outperformed gold, while on the other it has yet to make new highs. The explanation for this behaviour is of course the fact that silver got trashed last year during the general market meltdown, when it dropped in percentage terms much more than gold, and thus this year it has had much more ground to make up. This brings us immediately to the important issue of why silver has underperformed gold so markedly in recent weeks, and what this implies. As we will soon see the explanation is actually rather simple.
But first we will examine silver's recent performance on its year-to-date chart. On this chart we can see that while gold has been forging ahead in recent weeks, silver has bogged down at a level where there is obviously considerable resistance, and a bearish looking potential Head-and-Shoulders top has formed. For various reasons, however, silver is expected to abort this pattern and break out upside. A big reason is the strength in gold whose parabolic acceleration looks set to continue, and it is hardly likely that this will happen with silver dropping away. While there is some chance that silver might first drop back towards the neckline of its potential H&S pattern, in the event that gold reacts somewhat to ease its overbought condition, there is thought to be a fair chance that it will instead abort the pattern and break out upside almost immediately. All moving averages are in bullish alignment and with short-term oscillators such as the RSI and MACD indicators close to neutrality there is certainly plenty of upside potential.
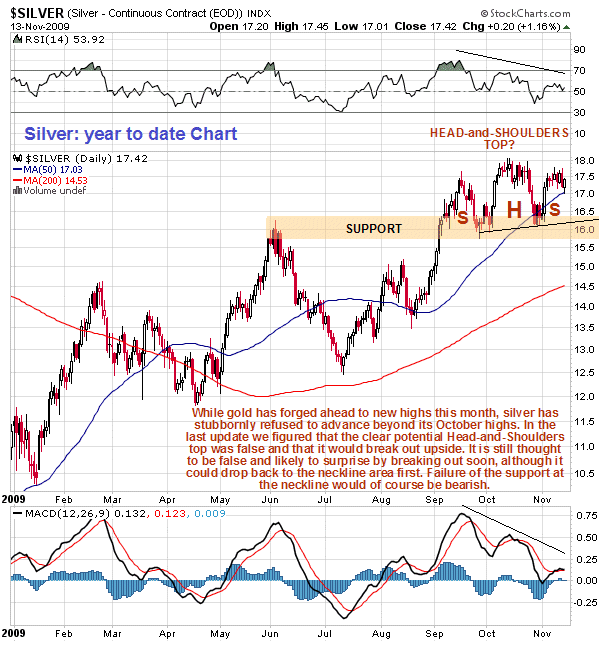
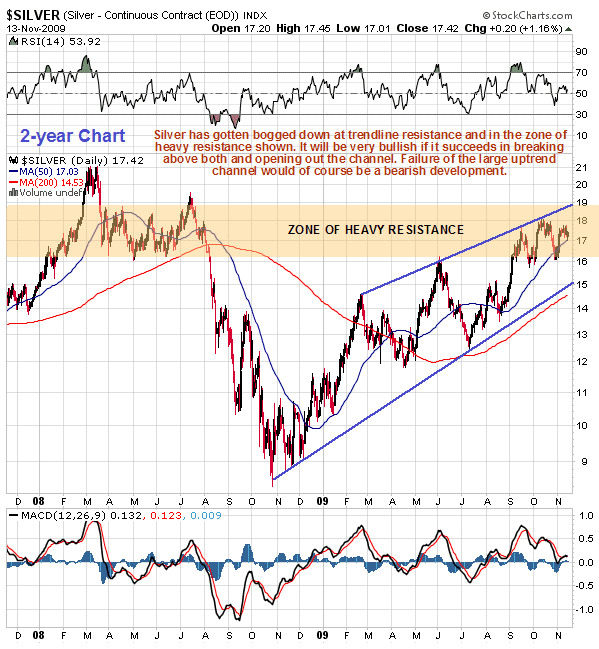
The reason for silver struggling at the current level becomes obvious when we look at it 2-year chart, on which we can see that it is working off the resistance generated by those poor unfortunates who bought in the first half of 2008 before the cave in, and who are now trying to "get out even". Once this supply is absorbed, silver will be free to advance more swiftly.
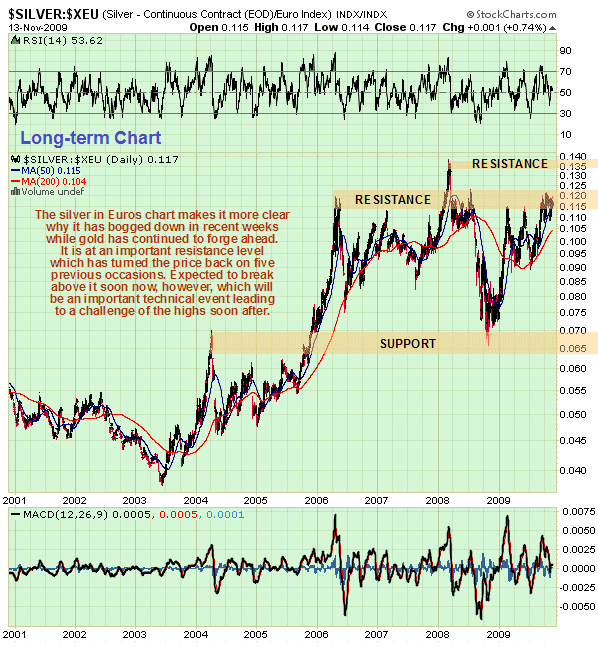
If we now factor in the decline in the dollar by using the long-term chart for silver in Euros, we can see that the concentration of resistance around and just above the current level is considerably greater than one would otherwise suspect by just looking at the normal chart in dollars. From this it should be obvious that once silver clears this resistance it will be free to advance much more rapidly as the remaining resistance near the highs is comparatively trivial.
Clive Maund, Diploma Technical Analysis
[email protected]
www.clivemaund.com
Copiapo, Chile, 15 November 2009

Clive P. Maund’s interest in markets started when, as an aimless youth searching for direction in his mid-20’s, he inherited some money. Unfortunately it was not enough to live a utopian lifestyle as a playboy or retire very young. Therefore on the advice of his brother, he bought a load of British Petroleum stock, which promptly went up 20% in the space of a few weeks. Clive sold them at the top…which really fired his imagination. The prospect of being able to buy securities and sell them later at a higher price, and make money for doing little or no work was most attractive – and so the quest began, especially as he had been further stoked up by watching from the sidelines with a mixture of fascination and envy as fortunes were made in the roaring gold and silver bull market of the late 70’s.
Clive furthered his education in Technical Analysis or charting by ordering various good books from the US and by applying what he learned at work on an everyday basis. He also obtained the UK Society of Technical Analysts’ Diploma.
The years following 2005 saw the boom phase of the Gold and Silver bull market, until they peaked in late 2011. While there is ongoing debate about whether that was the final high, it is not believed to be because of the continuing global debasement of fiat currency. The bear market since 2011 is viewed as being very similar to the 2-year reaction in the mid-70’s, which was preceded by a powerful advance and was followed by a gigantic parabolic price ramp. Moreover, Precious Metals should come back into their own when the various asset bubbles elsewhere burst, which looks set to happen anytime soon.
Visit Clive at his website: CliveMaund.com


