Gold Market Update: Margin Call Afflicted Investors Dump Everything Indiscriminately


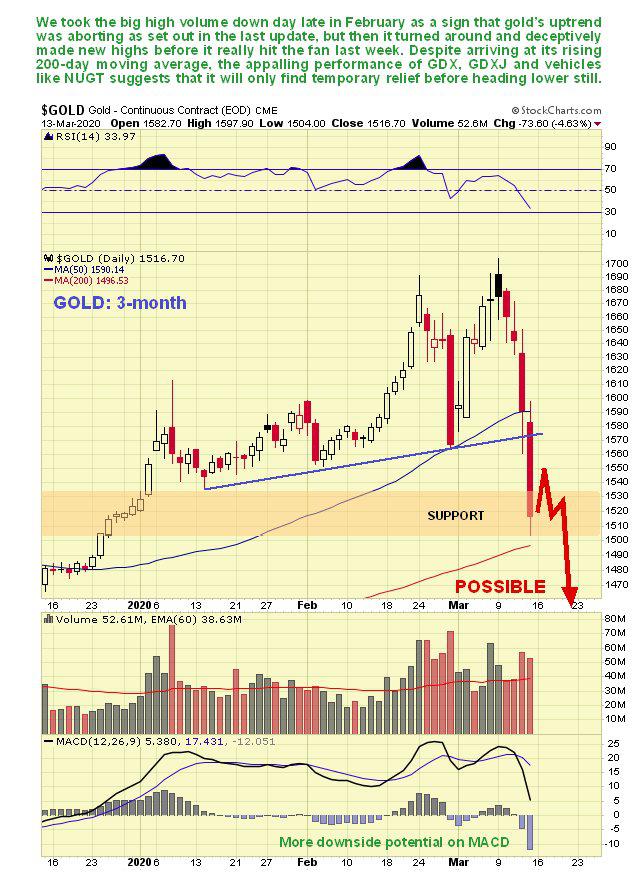
I got pelted with garbage after the last (bearish) update was posted on the 1st because right after, gold zoomed back up following a $75.80 plunge, as we can see on its latest 3-month chart below, and this “swansong rally” even made it to a marginal new high, but it did not negate the bearish implications of the late February plunge. In the last update it was written “This kind of massive smackdown, which took the gold price straight down to its rising 50-day moving average, is viewed as a clear “shot across the bows” and is interpreted as meaning Big Trouble.” The call was correct as demonstrated by last week’s steep plunge back to the rising 200-day moving average, and by Precious Metals stocks cratering last week in a dramatic manner. Last week’s developments, especially in stocks, means that gold has been “holed below the water line” and should now get taken down hard along with silver as margin call afflicted investors dump everything indiscriminately over the side.
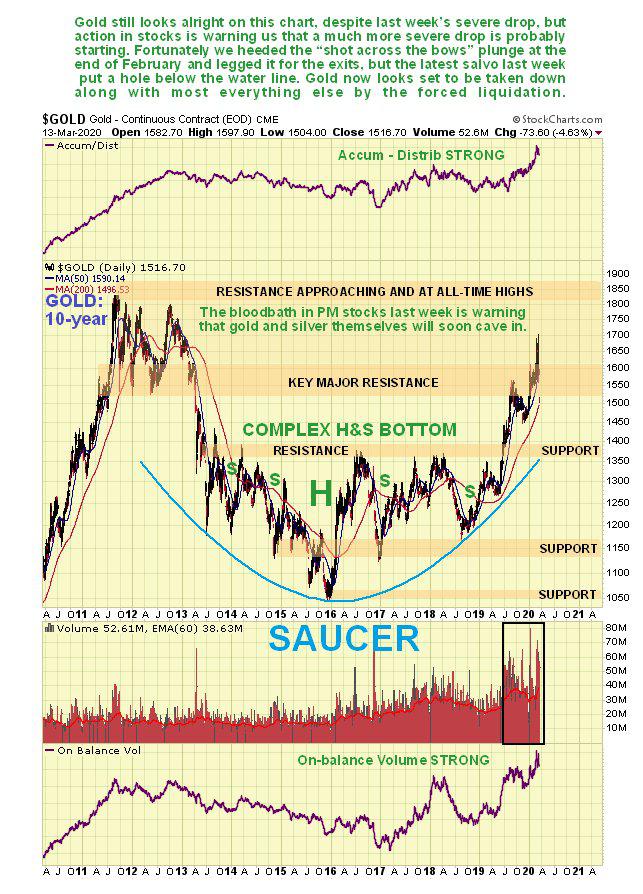
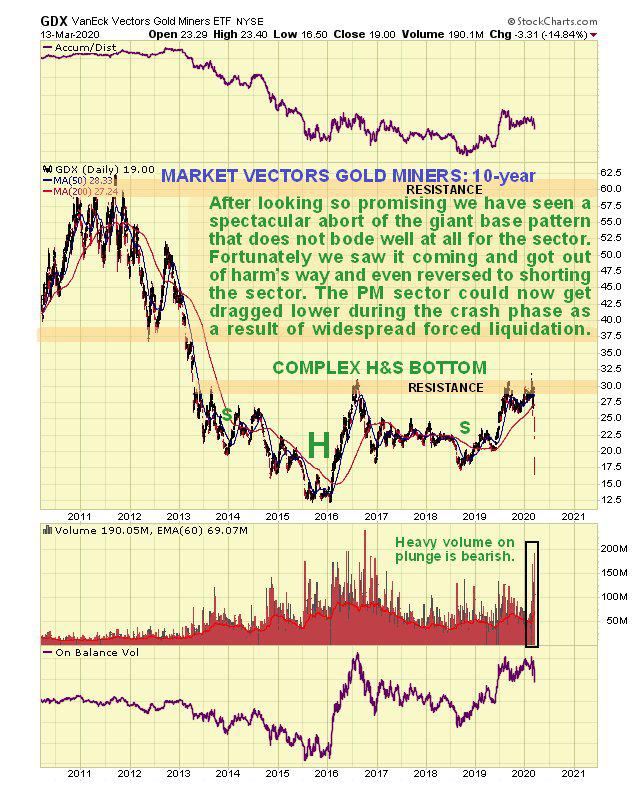
On gold’s 10-year chart you can scarcely see last week’s plunge, and we actually had a pretty decent rally up to just a week ago, but the message of cratering PM stocks is that gold is failing beneath its 2011 peak and will now get taken down along with most everything else. This chart shows that it could drop a long way from here.
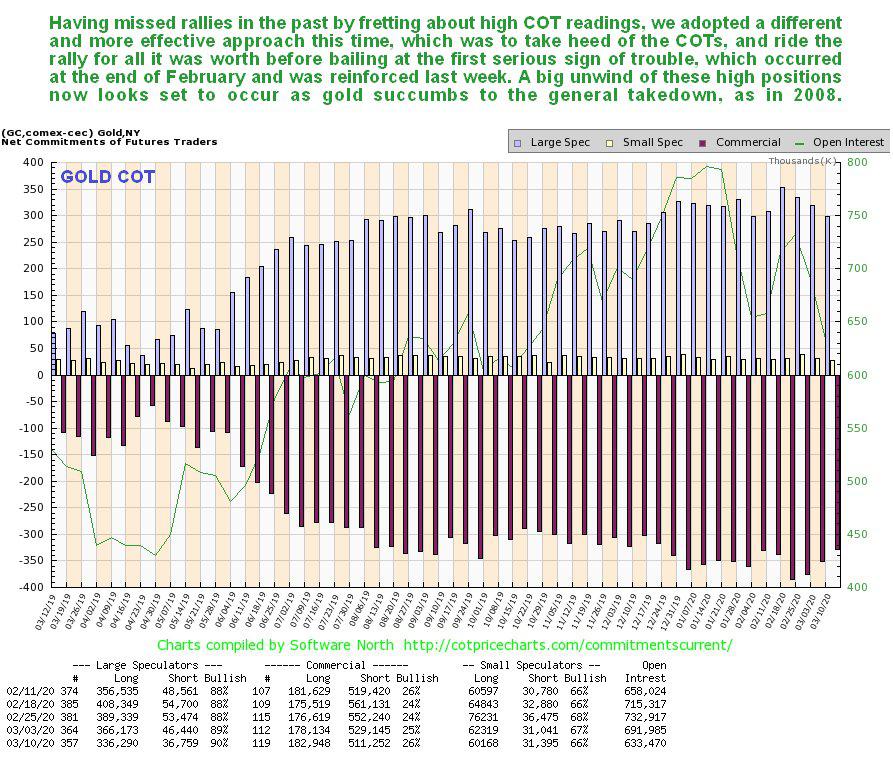
Having missed pretty sizeable rallies in gold in the past as a result of being deterred by extreme COT readings, we this time adopted a different and as it turned out more effective approach, which was to ride the rally for all it was worth while taking heed of the COT, and then to bail at the first sign of serious trouble, which occurred towards the end of February as detailed above, prompting the bearish Gold Market update posted on the 1st and the call for a sectorwide drop posted on the site on the 8th, the day before gold hit its final high for the advance. Actually we did more than just bail, going for Put options in GLD, in which one subscriber made enough to pay his subscription to the site for the next 300 years.
As mentioned above, PM stocks cratered last week, which is a very bearish omen for gold. So what happened? – let’s quickly review the latest most relevant charts.
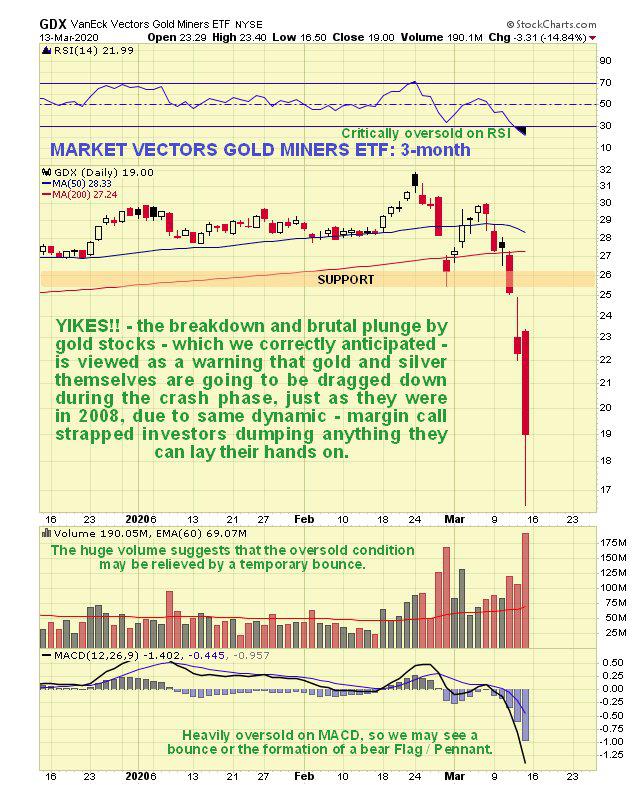
On the 3-month chart for GDX we can see that it went into freefall after key support at $25.50 failed, with the huge daily range and very heavy volume on Friday a sign of a selling climax and a temporary bottom. However, after consolidating this drop, perhaps by forming a countertrend bear Flag over the near-term, renewed decline to new lows is expected.
Just how serious this precipitous drop in GDX was we can see on its 10-year chart, which shows that it has already crashed support at its 2018 lows, in the process wrecking and aborting the hitherto promising pattern, which had looked like a giant base pattern. This chart as “Game over” written all over it.
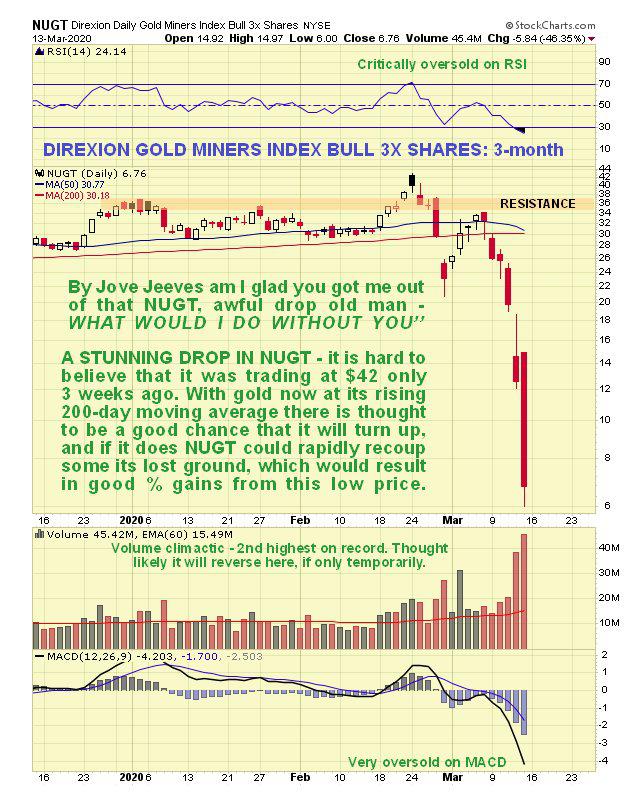
The bearish implications of the collapse in PM stocks last week is emphasized even more by the ruinous drop in some leveraged stock bull ETFs, like NUGT shown below, which went straight over a cliff. It is now so cheap that it is believed to have thrown up a profitable opportunity since their a good chance of a snapback rally that will result in significant percentage gains, after which it is likely to drop back again.
One reason for gold finally caving in last week is the extraordinarily sharp rally in the dollar followed a steep drop to hit our downside trendline target that we had earlier delineated.
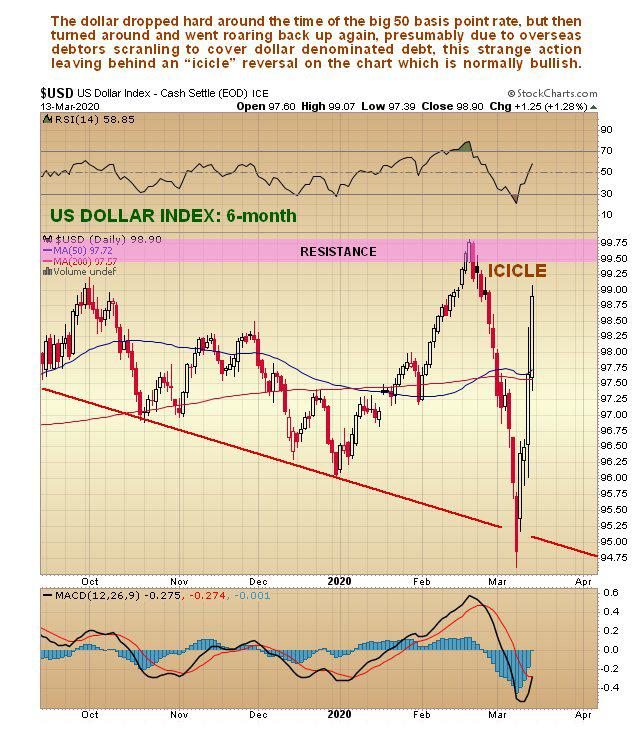
What seems to be happening with the dollar is that the drop due to the big rate cut has been reversed due to the global market meltdown leading to a clamor for dollars as overseas holders of dollar denominated debt scramble to cover their positions.
Those of you of a more esoteric inclination might like to see the extraordinary planetary lineup that is synchronizing with this crisis. The planetary map below shows that right now we have 4 planets in Capricorn, which is the astrological sign associated with business and hierarchical structures, and the moon will swing into this stellium in about 2 days, making 5 planetary bodies in this one sign. These include Mars, Saturn and Pluto, which are the “bad guys” of the zodiac that through the ages have been associated with heavy stuff (except that Pluto wasn’t discovered until 1930) and grouped together like this they constitute a veritable “wrecking ball”, which in astrological terms is why we are having this crisis at this time. Those of you who want to see this lineup have only to go outside before dawn and look above the eastern horizon. Note that you won’t see Pluto of course because it’s way too far away and too dim – you can only see it through a powerful telescope.
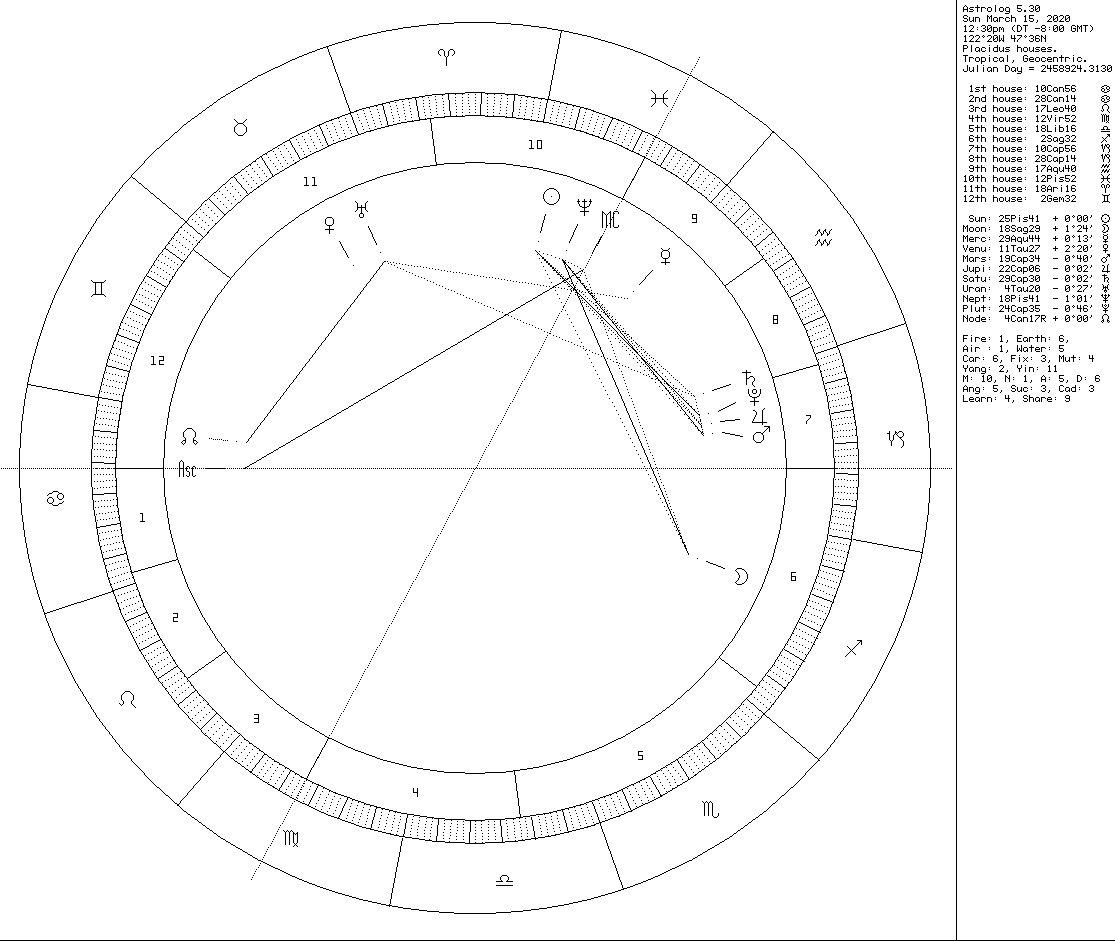
Click on map for a larger, clearer version.
Clive Maund
********

Clive P. Maund’s interest in markets started when, as an aimless youth searching for direction in his mid-20’s, he inherited some money. Unfortunately it was not enough to live a utopian lifestyle as a playboy or retire very young. Therefore on the advice of his brother, he bought a load of British Petroleum stock, which promptly went up 20% in the space of a few weeks. Clive sold them at the top…which really fired his imagination. The prospect of being able to buy securities and sell them later at a higher price, and make money for doing little or no work was most attractive – and so the quest began, especially as he had been further stoked up by watching from the sidelines with a mixture of fascination and envy as fortunes were made in the roaring gold and silver bull market of the late 70’s.
Clive furthered his education in Technical Analysis or charting by ordering various good books from the US and by applying what he learned at work on an everyday basis. He also obtained the UK Society of Technical Analysts’ Diploma.
The years following 2005 saw the boom phase of the Gold and Silver bull market, until they peaked in late 2011. While there is ongoing debate about whether that was the final high, it is not believed to be because of the continuing global debasement of fiat currency. The bear market since 2011 is viewed as being very similar to the 2-year reaction in the mid-70’s, which was preceded by a powerful advance and was followed by a gigantic parabolic price ramp. Moreover, Precious Metals should come back into their own when the various asset bubbles elsewhere burst, which looks set to happen anytime soon.
Visit Clive at his website: CliveMaund.com


