Gold Miners’ Q1’25 Fundamentals


The major gold miners just achieved their greatest quarter in history! The potent combination of amazing record gold prices and solid cost control fueled record revenues, record unit profits, record bottom-line earnings, and record operating cashflows. This sector has never witnessed such an epic fundamental backdrop. Yet gold stocks remain deeply undervalued because most traders still haven’t recognized this.
The GDX VanEck Gold Miners ETF remains this sector’s dominant benchmark. Birthed way back in May 2006, GDX has parlayed its first-mover advantage into an insurmountable lead. Its $13.8b of net assets mid-week dwarfed the next-largest 1x-long major-gold-miners ETF by over 10x! GDX is undisputedly the trading vehicle of choice in this sector, with the world’s biggest gold miners commanding most of its weighting.
Gold-stock tiers are defined by miners’ annual production rates in ounces of gold. Small juniors have little sub-300k outputs, medium mid-tiers run 300k to 1,000k, large majors yield over 1,000k, and huge super-majors operate at vast scales exceeding 2,000k. Translated into quarterly terms, these thresholds shake out under 75k, 75k to 250k, 250k+, and 500k+. Those two largest categories account for over 53% of GDX.
Gold stocks have enjoyed a strong 2025, with GDX soaring 53.1% year-to-date in mid-April! That made for 2.0x upside leverage to the metal they mine, on the low end of its historical range of 2x to 3x. Gold’s underlying surge left it crazy-overbought, so it has been pulling back since. Thus gold stocks have been correcting in sympathy, with GDX falling 12.3% as of midweek. Such selloffs rebalancing sentiment are healthy.
Yet despite the gold miners’ rallying, they have vast upside remaining. From early October 2023 to early May 2025, gold rocketed 88.1% higher in a simultaneous mighty cyclical bull and monster upleg! Not a single 10%+ correction was suffered in that remarkable span. At GDX’s normal 2x-to-3x leverage due to gold miners’ profits amplifying gold, the major gold stocks should’ve skyrocketed 176% to 264% during that!
But GDX only climbed 92.9% through that huge gold run, pacing the metal at under 1.1x leverage! That extreme anomaly can’t and won’t last, gold stocks need to revalue much higher to reflect their fantastic fundamentals with these lofty prevailing gold prices. Somewhere between half to two-thirds of that huge move is still coming! So speculators and investors really need to do their homework and deploy in gold stocks.
For 36 quarters in a row now, I’ve painstakingly analyzed the latest operational and financial results from GDX’s 25-largest component stocks. Mostly super-majors, majors, and larger mid-tiers, they dominate this ETF at 85.6% of its total weighting! While digging through quarterlies is a ton of work, understanding the gold miners’ latest fundamentals really cuts through the obscuring sentiment fogs shrouding this sector.
This table summarizes the operational and financial highlights from the GDX top 25 during Q1’25. These gold miners’ stock symbols aren’t all US listings, and are preceded by their rankings changes within GDX over this past year. The shuffling in their ETF weightings reflects shifting market caps, which reveal both outperformers and underperformers since Q1’24. Those symbols are followed by their current GDX weightings.
Next comes these gold miners’ Q1’25 production in ounces, along with their year-over-year changes from the comparable Q1’24. Output is the lifeblood of this industry, with investors generally prizing production growth above everything else. After are the costs of wresting that gold from the bowels of the earth in per-ounce terms, both cash costs and all-in sustaining costs. The latter help illuminate miners’ profitability.
That’s followed by a bunch of hard accounting data reported to securities regulators, quarterly revenues, earnings, operating cash flows, and resulting cash treasuries. Blank data fields mean companies hadn’t disclosed that particular data as of the middle of this week. The annual changes aren’t included if they would be misleading, like comparing negative numbers or data shifting from positive to negative or vice-versa.
With last quarter’s average gold prices blasting up 38.3% YoY to a stunning record $2,866, gold miners’ Q1’25 results had to be awesome. And they truly were, exceeding my high expectations on most fronts. If traders knew how this sector is minting money, they’d be rushing in to chase the resulting enormous upside potential. Glorious quarterly results will certainly help build awareness of this gold-mining windfall.
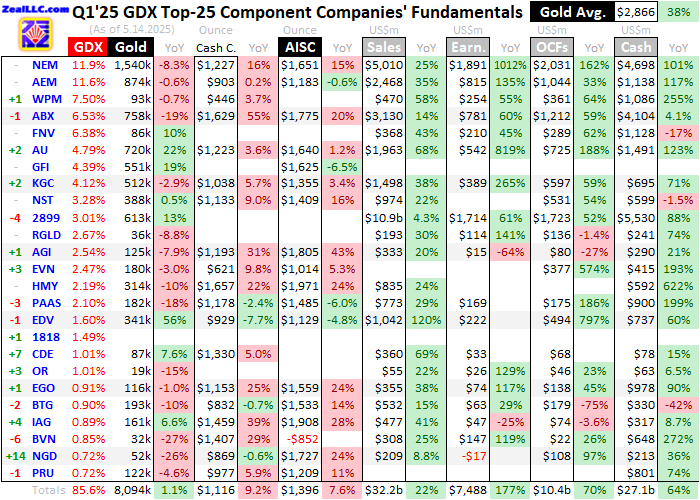
Production growth is essential for building gold-mining companies, providing the necessary cashflows to explore for new deposits, develop new gold mines, and expand existing ones. These elite GDX-top-25 gold miners delivered that last quarter, their collective output climbing 1.1% YoY to 8,094k ounces. That’s better than the global gold-mining industry as a whole, which is tracked quarterly by the World Gold Council.
Including both primary and byproduct gold miners, collective worldwide output only edged up 0.3% YoY to 27,513k ounces in Q1’25. That in turn was a steep 10.6% drop from Q4’24’s total! The GDX top 25 fared even worse, their production plunging 12.3% quarter-on-quarter which certainly sounds ominous. But this isn’t some gold-mining collapse, merely normal supply-side seasonals that affect production around the globe.
The WGC’s comprehensive data reveals world gold mine production isn’t steady as most assume. Going back to Q1’11, global mined gold output in Q1s, Q2s, Q3s, and Q4s has averaged -8.9%, +4.7%, +6.5%, and +0.6% QoQ! Q1s are always the weakest quarters of the year, suffering big output declines from the preceding Q4s. Surprisingly geography-driven climate is the primary factor behind these big production swings.
The Earth’s northern hemisphere contains 68% of its landmasses, and an even-higher mineable portion if Antarctica is excluded. So the great majority of gold mines are located in the top half of the globe, where winter weather peaks in Q1s. From bitter cold up north to heavy seasonal rains down south, operations are adversely impacted. That includes reducing efficiencies of heap-leach chemical reactions to recover gold.
With gold dissolved from ores slowing, so does output. Mine managers take advantage of these slower winters to schedule necessary plant maintenance, ensuring operations can run full-speed the rest of the year. Upgrades and expansions also tend to see concentrated implementation and construction during Q1s’ natural lulls. Getting all that done helps throughputs really pick up in Q2s and Q3s boosting production.
Last quarter actually saw the GDX top 25’s best Q1 output since Q1’21. Excluding the world’s largest gold miner and GDX’s biggest component, all the rest of these elite gold miners enjoyed way-better 3.5%-YoY production growth. Newmont has long struggled to overcome depletion at the vast scales it operates, leading to waning output. Last quarter its production dropped a steeper 8.3% YoY to just 1,540k ounces.
For decades Newmont has failed to grow organically, only through acquiring other gold miners. These mega-mergers dramatically boost gold output in the first four quarters after acquisitions, but at a heavy price. NEM’s management has a long history of way overpaying for competitors’ mines, necessitating subsequent colossal goodwill writedowns totaling tens of billions of dollars! Those have seriously hobbled profits.
Unfortunately that hasn’t only hurt Newmont shareholders, but this entire sector. The world’s largest gold miner is the only gold stock included in the S&P 500, the limit of many fund managers’ sector attention. So when NEM’s profits take huge hits on these all-too-common writedowns, general gold-stock sentiment is tainted. This along with other problems have made Newmont deadweight, dragging down GDX performance.
A case in point happened after Newmont reported its Q3’24 results in late October, when GDX was just 0.9% under achieving a fantastic 11.8-year secular high! NEM had been misleading on mining costs all year, which came in way higher than guidance. So its stock crashed 14.7% the next day, its worst daily loss in 27 years! That slammed GDX, decoupling it from record gold scuttling mounting bullish psychology.
Unit gold-mining costs are generally inversely proportional to gold-production levels. That’s because gold mines’ total operating costs are largely fixed during pre-construction planning stages, when designed throughputs are determined for plants processing gold-bearing ores. Their nameplate capacities don’t change quarter to quarter, requiring similar levels of infrastructure, equipment, and employees to keep running.
So the primary variable driving quarterly gold production is the ore grades fed into these plants. Those vary widely even within individual gold deposits. Richer ores yield more ounces to spread mining’s big fixed expenses across, lowering unit costs and boosting profitability. But while fixed costs are the lion’s share of gold mining, there are also sizable variable costs. That’s where recent years’ raging inflation hit hard.
Cash costs are the classic measure of gold-mining costs, including all cash expenses necessary to mine each ounce of gold. But they are misleading as a true cost measure, excluding the big capital needed to explore for gold deposits and build mines. So cash costs are best viewed as survivability acid-test levels for the major gold miners. They illuminate the minimum gold prices necessary to keep the mines running.
Last quarter the GDX top 25’s average cash costs rose 9.2% YoY to $1,116 per ounce. Interestingly those still fell 3.6% QoQ from Q4’24’s record $1,157. So the major gold miners were doing a solid job holding the line on mining costs. As a proportion of quarterly-average gold prices, Q1’25 cash costs ran just 0.389x. That was the best by far since Q4’20, when they hit their last-36-quarter low at a similar 0.373x.
All-in sustaining costs are far superior than cash costs, and were introduced by the World Gold Council in June 2013. They add on to cash costs everything else that is necessary to maintain and replenish gold-mining operations at current output tempos. AISCs give a much-better understanding of what it really costs to maintain gold mines as ongoing concerns, and reveal major gold miners’ true operating profitability.
Naturally cash production costs are the largest component of AISCs by far, so rising cash costs drive up AISCs proportionally. Indeed the GDX top 25’s Q1’25 average climbed 7.6% YoY to $1,396 per ounce. That was better than I expected, ranking fourth-highest after Q4’24’s $1,454, Q3’24’s $1,431, and Q3’22’s $1,405. In a mid-April essay on GDX’s gold pursuit quickening, I estimated about $1,500 prior to Q1 results.
The most-important favorable factor was Peru’s Buenaventura reporting stunning negative AISCs running -$852! How is that possible? This polymetallic miner produces lots of silver, zinc, and lead it uses as byproducts to offset gold-mining costs. With only 29% of its Q1’25 revenues coming from gold, BVN sure isn’t a primary gold miner. But it has always done gold-centric reporting, enjoying gold stocks’ valuation premium.
That’s relative to base-metals miners, not general stock markets! Gold stocks’ AISCs are production-weighted averages across all mines in a company’s stable. Last quarter Buenaventura had one showing a shocking -$9,042 gold AISCs due to huge byproduct credits! Negative overall gold AISCs are nothing new for BVN to report, as in 2024’s Q1, Q2, and Q3 they also ran -$121, -$578, and -$680 per ounce.
I’m tempted to exclude them, but can’t for consistency’s sake. Throughout this research thread’s long 36-quarter history, many quarters have had extreme high-AISC outliers for various reasons dragging the GDX-top-25 average higher. I always included all reported AISCs in the quarterly averages, and have to continue doing so for comparability. But excluding BVN’s, the rest of the GDX top 25 averaged $1,528 in Q1’25.
But those are almost universally expected to come down in 2025. Again AISCs are inversely proportional to production, and Q1s suffer the weakest output of the year. As that ramps back up in Q2s, Q3s, and Q4s, AISCs tend to retreat. The GDX top 25’s full-year-2025 AISC guidances averaged a much-better midpoint of $1,426. Newmont was among the worst despite the supposed synergies of its sprawling operations.
NEM projected stunningly-high midpoint AISCs of $1,630 in 2025, much worse than 2024’s $1,516. And those are even higher than Q3’24’s $1,611 which caused its stock to crash delaying GDX’s important dozen-year secular breakout for another five months or so! Newmont’s 2025 AISC midpoint is 85% of the way up into the entire GDX top 25’s range of $957 to $1,746. Most major gold miners are doing much better.
Despite overall GDX-top-25 AISCs rising that 7.6% YoY last quarter, gold’s Q1 average prices soaring that blistering 38.3% YoY far outpaced mining costs. That made for explosive profitability for major gold miners, as evident in the best proxy for sector unit earnings. That simply subtracts GDX-top-25 average AISCs of $1,396 from the quarterly-average gold price of $2,866, yielding epic record profits of $1,470 per ounce!
Those catapulted up an astounding 89.7% YoY, their biggest jump in at least these last 36 quarters! But major gold miners achieving colossal unit earnings growth is no flash in the pan. Gold-mining profits have been soaring for fully seven quarters in a row now! Starting in Q3’23, GDX-top-25 unit earnings rocketed up 87.2%, 46.7%, 31.5%, 83.7%, 74.0%, 77.5%, and 89.7% YoY! That’s way unparalleled in all the stock markets.
And this astounding run of epic earnings growth isn’t finished. With this current Q2’25 about half-over, gold is already averaging another record $3,243. Even if gold needs to correct after hitting mid-April’s crazy-overbought levels, this will almost certainly still prove gold’s highest quarter ever. Assuming GDX-top-25 AISCs track near that midpoint guidance, their profits could soar another 65% YoY over $1,800 per ounce!
With gold miners’ record-shattering fundamentals still going strong, investors including funds should be increasingly chasing gold stocks’ colossal upside potential. This contrarian sector remains relatively small compared to broader stock markets, with the GDX top 25’s collective market capitalization running at just $460b. Entering May, all the elite S&P 500 companies’ market caps weighed in at a whopping $49,992b.
Last quarter’s hard accounting results reported to securities regulators confirmed that unit-earnings proxy. The GDX top 25’s total revenues climbed 22.5% YoY to $32.2b. While technically under Q3’24’s $34.2b, that is still a record. The major foreign gold miners in GDX’s upper ranks have different and sometimes-erratic reporting. That includes half-years rather than quarters and inconsistent results release schedules.
Those only higher sales a couple quarters ago included revenues from South Africa’s Goldfields and China’s Zhaojin Mining, neither of which had released Q1’25 numbers as of midweek. GFI alone mined 551k ounces of gold last quarter, which would’ve been worth around $1.6b in sales at Q1 average prices. So if this dataset was complete, there’s no doubt the GDX top 25 would’ve had their highest revenues ever.
And even with six of these majors not reporting earnings last quarter compared to four in the comparable Q1’24, GDX-top-25 bottom-line profits skyrocketed 177.0% YoY to a record-shattering $7.5b! That just trounced Q3’24’s previous record of $5.3b. No other stock-market sector is earning money as fast as the gold miners in this environment. Sooner or later their stock prices will have to reflect huge underlying profits.
The GDX top 25’s average trailing-twelve-month price-to-earnings ratio midweek weighed in at 34.4x, not very impressive. Yet that was skewed high by the four royalty and streaming companies in these upper ranks, which are always bid to far-higher valuations. Wheaton Precious Metals, Franco-Nevada, Royal Gold, and OR Royalties averaged absurd 104.6x TTM P/Es! Royalty plays are far too expensive for my blood.
Excluding them, the rest of the GDX top 25 now average TTM P/Es of just 19.6x earnings! Plenty are even trading in the low double digits and even single digits. And not all these midweek P/Es yet reflect these latest Q1’25 results, as much reporting was just finished in the week leading into May 15th. Major gold stocks remain deeply undervalued, way too cheap compared to massive underlying corporate profits.
Cash flows generated from operations also soared 70.1% YoY to a record $10.4b, just slightly behind Q3’24’s where more GDX-top-25 gold miners had reported them. Strong operating cashflows are crucial to finance mine expansions, builds, and purchases, fueling essential future production growth. More of all three are being announced by major gold miners, which will contribute to even stronger earnings down the road.
Those massive OCFs catapulted the GDX top 25’s collective cash treasuries up 64.3% YoY to a colossal $27.1b! They’ve never been anywhere close, with the previous highwater mark merely $22.8b way back in Q4’20. Flush with so much cash, approving expansions, new mine construction, and acquiring other gold miners will really accelerate in coming quarters. That will drive more sector interest among fund investors.
This last quarter was truly phenomenal for the major gold miners, their best ever by far! Lofty record gold prices are working wonders for this long-neglected sector, fueling exploding profits. So normally after all this analysis I’d be pounding the table on buying gold stocks. But as I’ve explained in depth in both our subscription newsletters since mid-April, the entry timing isn’t optimal. Gold is highly likely to suffer a correction.
My essay several weeks ago on crazy-overbought gold analyzed why, which I followed up on a week later discussing gold’s selloff hitting miners. A correction is a 10%+ gold selloff, which the major gold stocks will leverage by 2x to 3x like usual. That means speculators and investors alike should be able to buy into great gold stocks considerably lower once gold’s correction runs its course. So it’s prudent to wait for that.
Our upcoming newsletters will continue to analyze all these timing and price-level considerations in real-time, adapting our redeployment into great hand-picked fundamentally-superior high-potential smaller gold miners as we go. If you don’t want to miss that and our resulting specific gold-stock trades, please subscribe to our newsletters and support our research work. The ideal gold-stock buying window could be short.
Successful trading demands always staying informed on markets, to understand opportunities as they arise. We can help! For decades we’ve published popular weekly and monthly newsletters focused on contrarian speculation and investment. They draw on my vast experience, knowledge, wisdom, and ongoing research to explain what’s going on in the markets, why, and how to trade them with specific stocks.
Our holistic integrated contrarian approach has proven very successful, and you can reap the benefits for only $10 an issue. We extensively research gold and silver miners to find cheap fundamentally-superior mid-tiers and juniors with outsized upside potential. Sign up for free e-mail notifications when we publish new content. Even better, subscribe today to our acclaimed newsletters and start growing smarter and richer!
The bottom line is the major gold miners dominating GDX just achieved their best quarter in history! Far-higher gold prices combined with solid mining-cost control fueled record revenues, record unit profits, record bottom-line earnings, record operating cashflows, and record cash treasuries. Average sector per-ounce earnings in particular have now skyrocketed for seven consecutive quarters, an unparalleled run.
Despite their best fundamental performances ever, gold stocks remain deeply undervalued relative to their underlying corporate profits. This extreme anomaly won’t last, gold stocks have to revalue much higher. Yet now isn’t the time to aggressively deploy capital in gold stocks with their metal staring down the barrel of a necessary and healthy correction-grade selloff. That would briefly drag gold stocks even lower.
*******


