Gold Miners - A Historic Revaluation Will Occur


 It is fairly common knowledge that the gold mining industry has been one of the worst performing sectors in the capital markets over the last five years. From major established gold producers such as Harmony Gold Mining and Kinross falling to under $2 per share amidst doubts about their ability to service debt, to the bankruptcy or fire-sale takeover of countless junior exploration companies -- the decline in gold prices over the last few years has spared few victims in the mining world.
Numerous fundamental reasons have been offered to explain the severity of the decline. Rising cash costs, an inability to finance exploration at favorable rates, and fears of mine nationalization have all been raised as reasons for the brutal bear market. While we can see merit to each possibility, as fundamental-based technicians we would rather let the market show us its opinion as opposed to trying to pinpoint a single scapegoat.
Given that we expect a historic low to be forming in gold over the course of the next 6-12 months (LINK: https://www.gold-eagle.com/article/gold-forecast-final-low-targets-bear-...), it seems appropriate to revisit the gold mining sector at this juncture to have a glimpse of what might be the fate of the surviving companies that actually dig the precious metal out of the ground.
"Our analysis shows that a significant revaluation in this sector is due to begin over the course of the next 12-18 months. There are historical precedents for individual companies to see gains well in excess of 1,000% during these types of revaluations. Because even a small allocation of one's portfolio to this thesis can have a tremendous wealth-building effect, we present the case here."
The XAU Gold & Silver Mining Index
Several gold and silver mining indices exist in the equity world, including the XAU, HUI, BGMI, and GDX, but for our purposes we will start with the XAU index. The XAU (Philadelphia Gold & Silver Index) happens to be the weakest of the bunch, which is why we prefer to use it for charting. It is preferable to examine the weakest index when looking for signs of a true bottom across the sector.
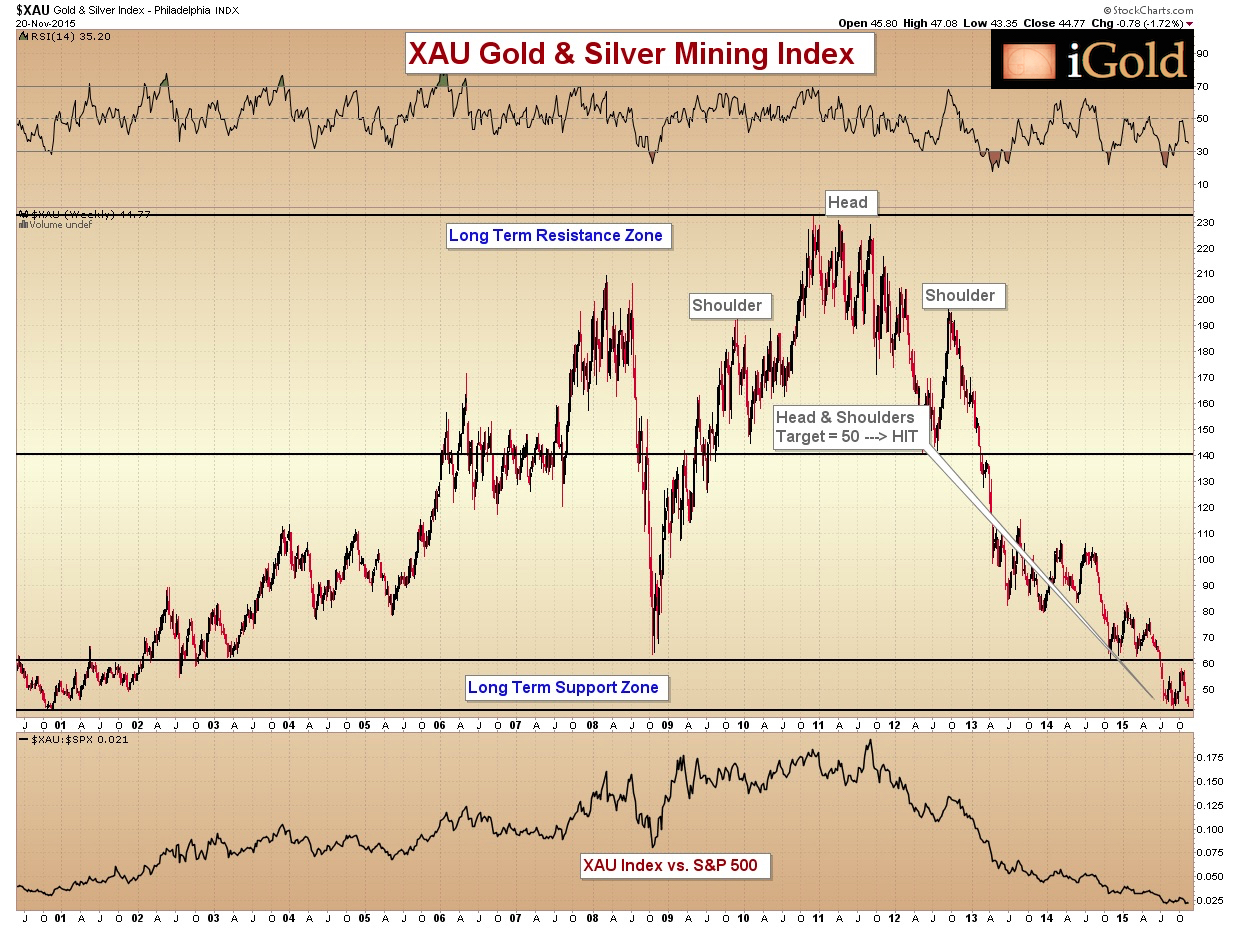
Our first chart shows the XAU since 2000, when gold prices bottomed at $250 per ounce. Note the strong but choppy rise from 2000 through the crash of 2008, followed by a recovery to new nominal highs into 2011, which then led to the current bear market. The XAU stands now at roughly the same level as it was in 2000. In other words, as a group, gold miners have shown zero net profits even as gold prices rose from $250 to above $1,000 today. Disappointing is an understatement.
Zooming into the price action after the recovery from 2008 shows an ominous topping signal that had formed, as a massive head and shoulders pattern developed through 2012 and gave a downside target of 50 on the index. Three years later into 2015, that target has been hit perfectly, and the XAU once again stands at an important long term support level.
In essence, the gold and silver miners have gone nowhere in 15 years.
A Generational View of the XAU
Backing our XAU chart out to a 30+ year timeframe provides a much better frame of reference with which to view the current price action.
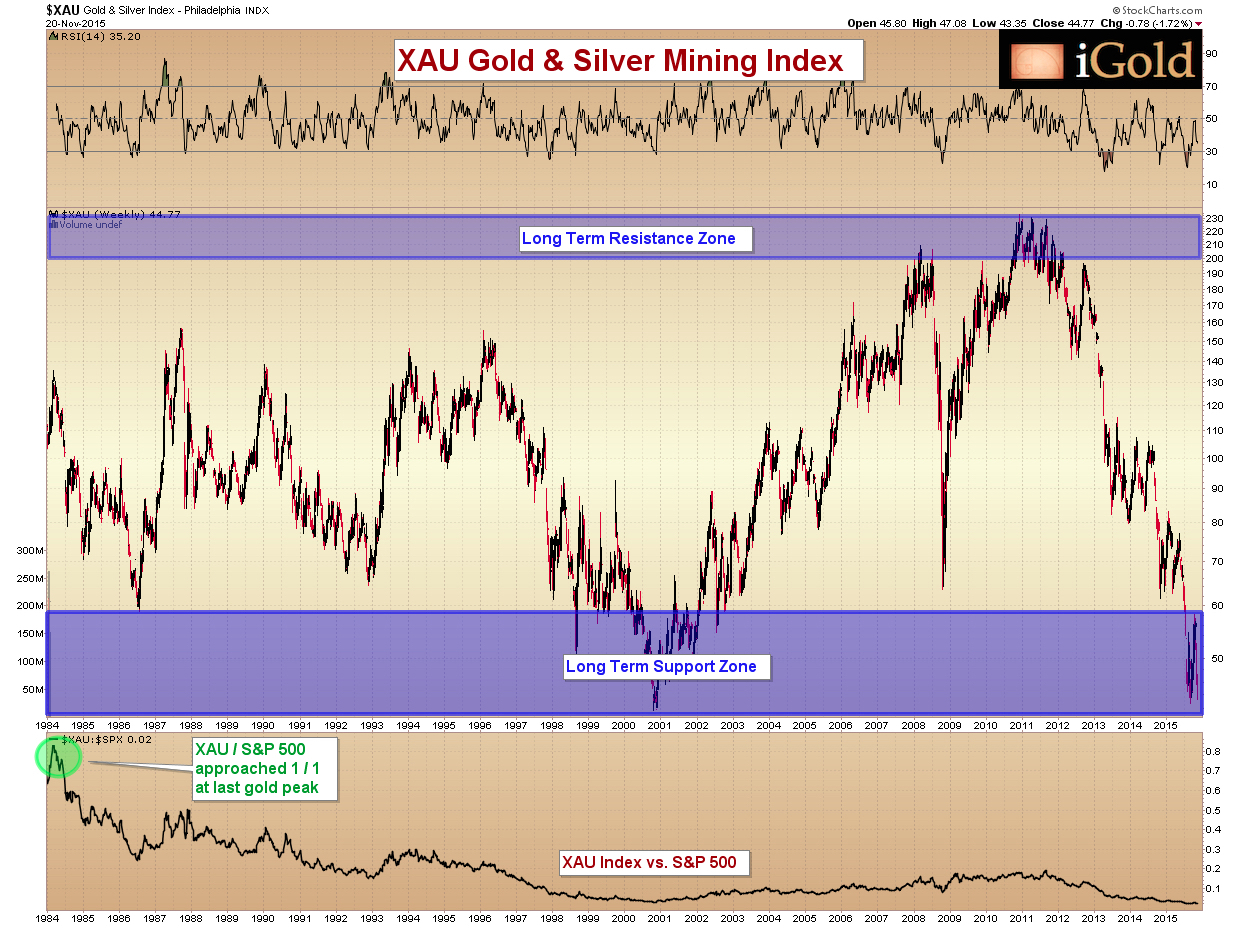
Note that the two blue bands labeled 'Long Term Resistance Zone' and 'Long Term Support Zone' actually extend back for over a generation, holding prices of XAU gold and silver miners in check both on the upside and the downside.
Essentially, what we have is a volatile 35-year consolidation pattern, with prices currently toward the lower end of that consolidation zone. We are big fans of long-term consolidation patterns, as they tend to lead to long-term advances when they do finally break out for good. Please see our original article comparing the multi-decade consolidation breakout in gold with that in the Dow Jones Industrial Average from 1959 - 1962 for a more detailed look at what such patterns entail for future prices. (LINK: https://www.gold-eagle.com/article/gold-forecast-multi-decade-breakouts-...)
The Power of Real Asset Ratios
Long-term ratios between real asset classes are one of our favorite macro trend indicators. As a simple example, most people are familiar with the ratio between gold to silver, which currently stands at 75 ounces of silver needed to buy one ounce of gold. Over the last century, this ratio has varied between 15 and 100.
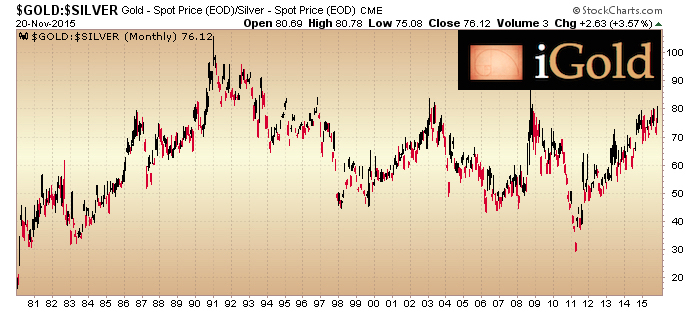
While this ratio does vary significantly over the years , the one thing that we can say for certain is: the gold to silver ratio will never go to zero. This is critically important. There are not many certainties that can ever be proclaimed in the investment world, but barring an act of God, we can say for certain that the ratio between these two real asset classes will never go to zero.
This is in stark contrast to the possibility that exists when looking at an individual stock, bond, or currency: all of these assets can indeed go to zero. Again, ratios between real assets cannot.
The Gold / XAU Ratio
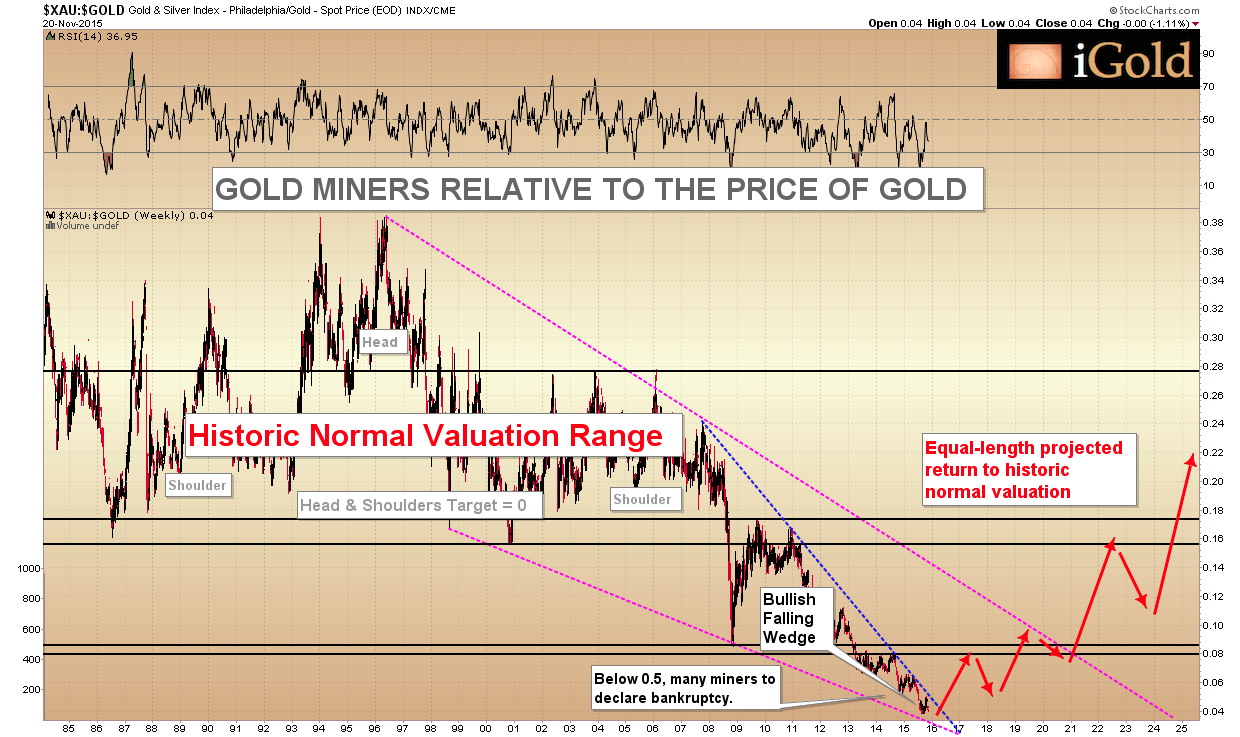
A look at the 30+ year chart of the XAU / Gold ratio, which is another ratio between real assets (gold in the ground vs. gold above ground) provides an illuminating look at the state of the global mining industry.
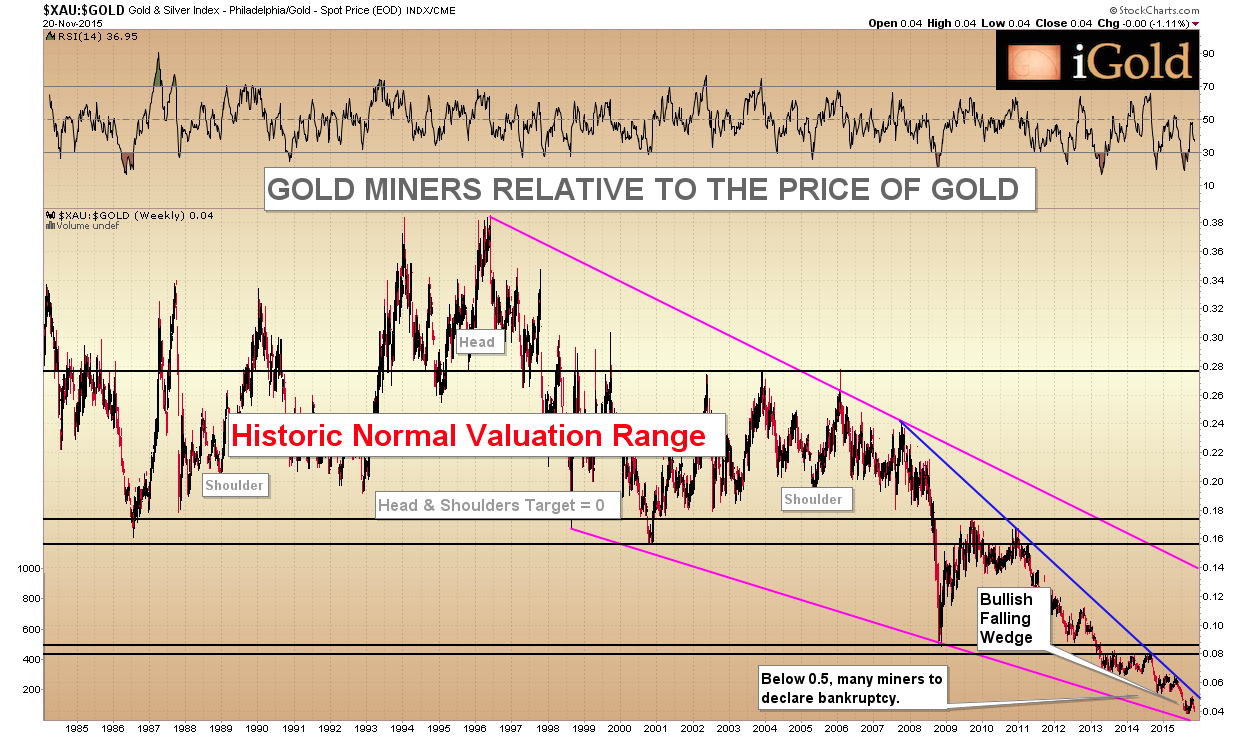
Note that the high in this ratio did not come in 2011 with the all-time high in gold at $1,917/oz. It actually came in 1996, with gold below $400 and the XAU at 150. Since that high, the ratio has been in a 20-year downtrend, shown in the magenta trend lines on the chart above.
Note further that the ratio actually gave a two-decade topping signal that took the form of a head and shoulders pattern, which completed during the crash of 2008. As absurd as it sounds, the target of the topping pattern given is zero (0).
Here technical analysis shows its inherent limitations, because this pattern is calling for the ratio of these two real asset classes to reach zero. As we have said prior, the ratio for these two real assets cannot go to zero in any realistic probability of future events. If it were to do so, it would be the first time in recorded human history that gold in the ground is worth zero compared to gold above ground-- and that is not a likelihood worth investing in.
So what does this low target mean? When caught between a rock and a hard place, the answer is the hard place. In the case of the XAU to gold ratio, the answer is that the ratio is going to get very low.
And indeed, it has. As this article goes to press, the ratio stands at just 0.4. So how much lower can it fall? While mathematically there may be infinite points between 0.4 and 0, in practicality the ratio has already seen the bulk of its decline. The ratio has already seen a loss of over 90% from its peak in 1996.
Stein's Law says: "That which cannot go on forever will one day stop."
Such will be the case for the drop in the XAU index relative to gold. And, we are willing to place our money on the theme that the bulk of the damage to the mining industry has already been done.
Zooming in on the Ratio
Looking again at the chart above, the sub-pattern forming since 2008 in the XAU/Gold ratio is hinting at a trend change soon to materialize. Shown in blue within the primary magenta downtrend above, a bullish falling wedge has been grinding downward toward its apex point for the past six years. This is a pattern in which both the highs and lows are still falling, yet the slope of the lows is not as steep as that of the highs. In fundamental terms, it means that buyers are coming into the market at relatively higher levels than sellers at each progressive market turn. This fundamental backdrop typically results in a break to the upside as sellers become exhausted and buyers remain active. This is what marks significant long-term bottoms at historic valuation extremes.
Given decades of prior valuation data for the XAU to gold ratio, let us give an educated speculation that the ratio will indeed avert zero, and instead begin a process of returning to the mid-range of that historic norm over the next decade.
What form would such a revaluation take?
We do not claim the revaluation to happen quickly. For example, the fall from the prior norm of 0.22 down to 0.4 will have taken a total of nine years. Let us assume that a rise back into the mid-range takes an equal amount of time. Extending our chart into the future gives our projection for what this return to a historic normal valuation would look like, shown by the red arrows through 2025.
The Potential Gains for Surviving Miners
Yes, some gold and silver miners have gone bankrupt during this bear market, and others surely will. And this is part of the process that sets the stage for the next bull market. What might we expect for those companies that survive into the next stage?
While nine years may seem like a long time to wait for such a revaluation, keep in mind we are talking about a ratio, and so each increment of 0.4 higher represents a 100% move in the underlying XAU at current gold prices.
For example, if gold prices were to maintain current levels and the ratio were to regain its historic valuation of 0.22, the average XAU miner would see a 450% increase in share price over this time.
If gold prices were to retest the former $1,917 high (an 80% rise from today's price), the average XAU miner would see a 810% rise to return to a historic normal valuation.
Considering that the XAU to gold ratio could increase further toward its 1990's peak multiple, and that the superior gold/silver miners often see gains far in excess of the XAU average during a bull market, there are mathematical precedents for gains of 1,000% to 3,000% over the course of this revaluation for the top performing mining companies.
All of these calculations use prior normal valuation ranges, and no new highs in the prices of the metals.
Are there historic precedents for such large gains in mining companies?
Of course: we need only go back to the smaller revaluation that occurred from 2008 - 2011 to find plenty of examples. Again, note that we are talking about a future revaluation that, according to the data, will be well in excess these past examples.
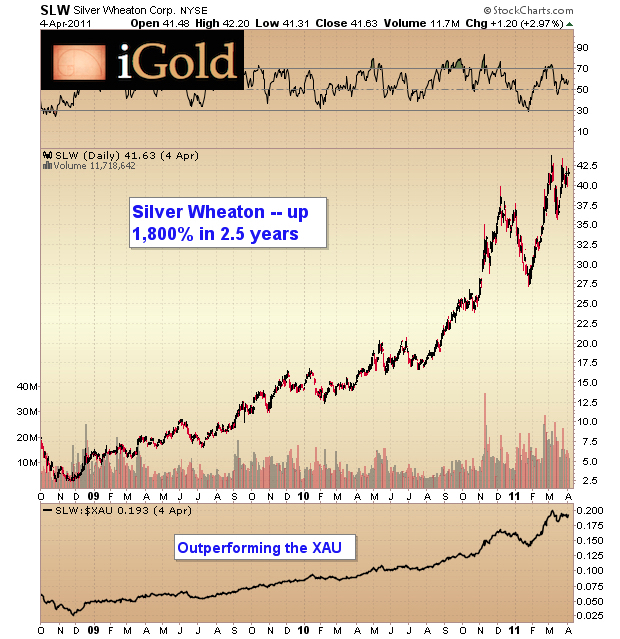
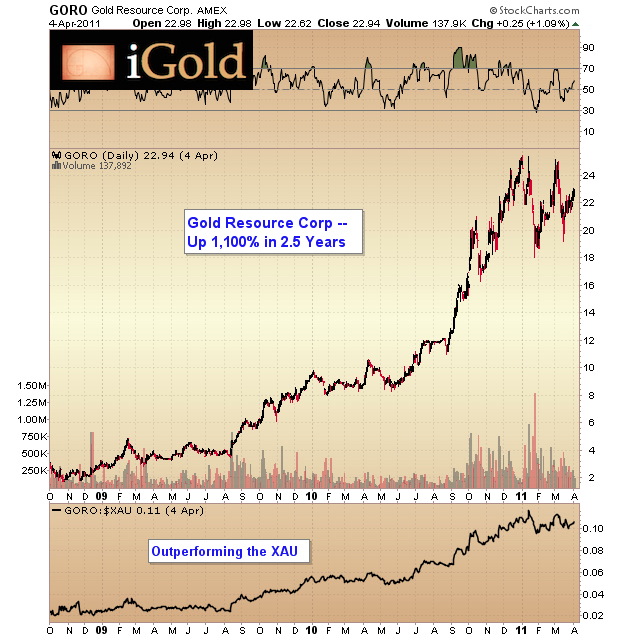
Yes -- we are cherry picking two of the better-performing mining companies during the last major revaluation for all precious metals miners.
And that is exactly our point: the time to own these companies is only when they have the potential to be revalued so favorably. We are again approaching one of these times.
The clue to when this revaluation will begin will come when the bullish wedge (shown in blue above) on the XAU to gold ratio breaks decisively to the upside. As the model shows, this should occur sometime by Spring of 2017.
Takeaway on Precious Metals Miners
We are not predicting this breakout within the next week or month, and we certainly do not recommend going "all in" on any one miner at any one time. Furthermore, thorough due diligence is necessary on each mining company, because the performance differential between the top performing and the worst performing companies in the sector will be many hundreds of percentages points.
Yet, according to our model, for those companies that survive the current bear market, one of two things is going to happen by mid-2017:
1) The ratio of the XAU to gold is going to approach zero (0) for the first time in history.
OR
2) The ratio is going to break out of its downtrend somewhere above zero and begin a tremendous revaluation process.
We have made the case that outcome (2) is the one worth investing in. Given the potential for plus-1,000% gains during this revaluation, we believe it is critical that investors fully consider these historic precedents, and employ thorough diligence when selecting individual mining companies for consideration.
********
To view our latest video update covering analysis of gold and silver prices, you may watch our free video on our website: [LINK: http://igoldadvisor.com/2015/11/23/gold-vs-us-dollar/]. New video updates are posted twice per week.
********

Christopher Aaron began his career as an intelligence analyst for the CIA and Department of Defense. He served two tours to Afghanistan and Iraq between 2006 - 2009, conducting pattern-of-life mapping for military leaders.
Mapping shares similarities with technical analysis of the financial markets because both involve the interpretation of repeating patterns found in human nature. He is the founder of iGold Advisor, providing independent research and analytics on all aspects of the precious metals markets.
He speaks regularly on the cyclical patterns found within the financial markets and on international policy. He has been featured in the New York Times and NPR news amongst other financial publications.


