Gold: Monthly Closing Above USD 2,000 Triggers Breakout Rally


Review
Commencing from the low on October 6th at USD 1,810, the price of gold surged by nearly USD 200 or 11% in the subsequent three weeks, reaching USD 2,009. A two-week retracement brought the prices back to the 200-day moving average (back then at USD 1,933) by mid-November. However, new buyers swiftly emerged at this crucial support, allowing gold prices to promptly recover. Consequently, prices consistently flirted with the psychological USD 2,000 mark in the past trading week, only to shot up to USD 2,046 as of today. Gold – Monthly Closing Above USD 2,000 Triggers Breakout Rally.
Closing at USD 2,002.49, gold concluded the last trading week just slightly above USD 2,000. If, on the upcoming Thursday evening, November 30th, gold can close above USD 2,000, the long-awaited first monthly closing above this significant psychological threshold would have finally been achieved.
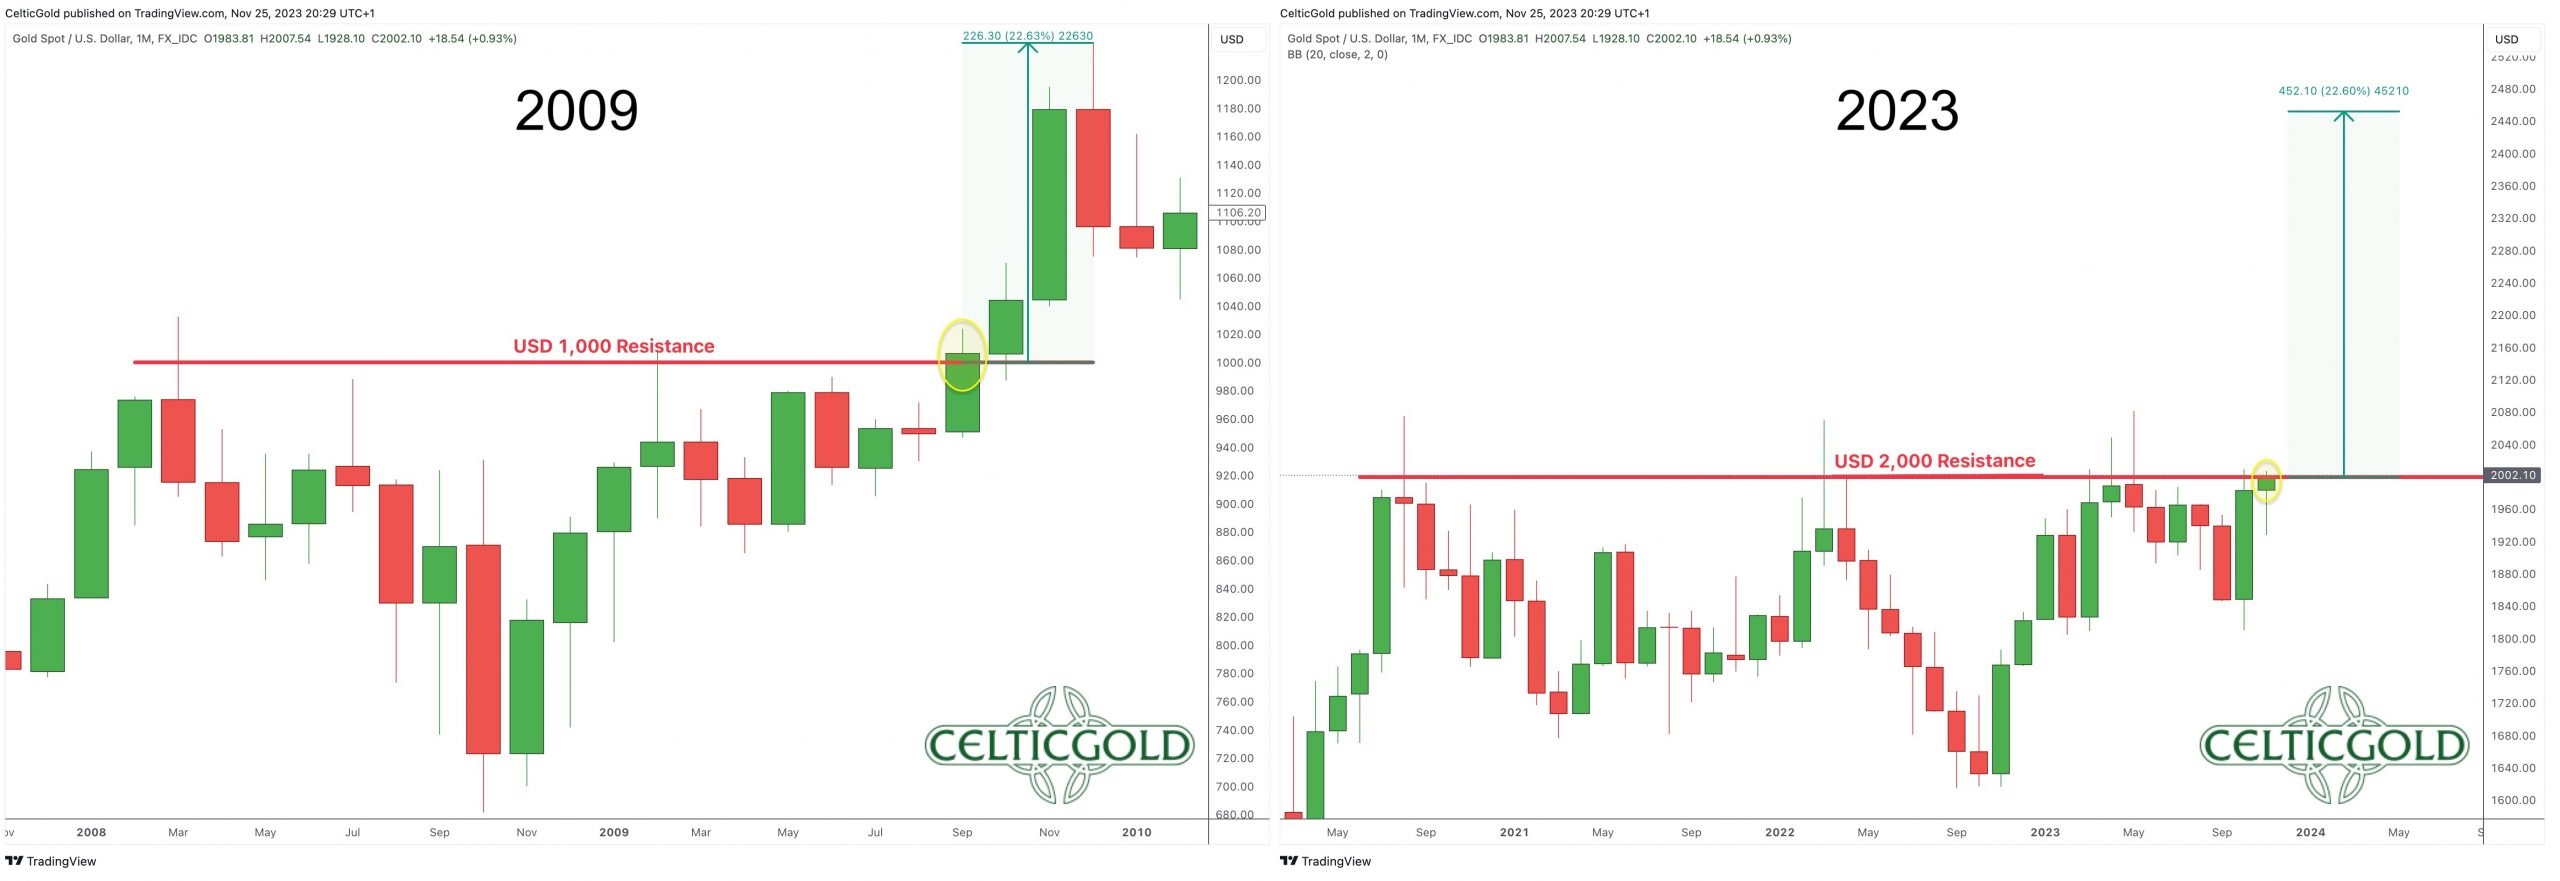
Gold in US-Dollar, monthly chart as of November 29th, 2023. Source: Tradingview
A comparable situation was last observed approximately 14 years ago. Back then, gold had been attacking the USD 1,000 mark for many months. But it was not until the first monthly closing above USD 1,000 in late September 2009 triggered an explosive breakout rally. Over the ensuing three months, gold prices exploded higher, surging by around 25% to USD 1,225 without any notable pullbacks.
A similar scenario is envisaged this time. Indeed, the probabilities strongly favor that gold prices will close the month of November or December above USD 2,000. Thereafter, an impressive breakout rally should be anticipated until spring 2024.
Chart Analysis – Gold in US-Dollar
Weekly chart: Shortened Right Shoulder
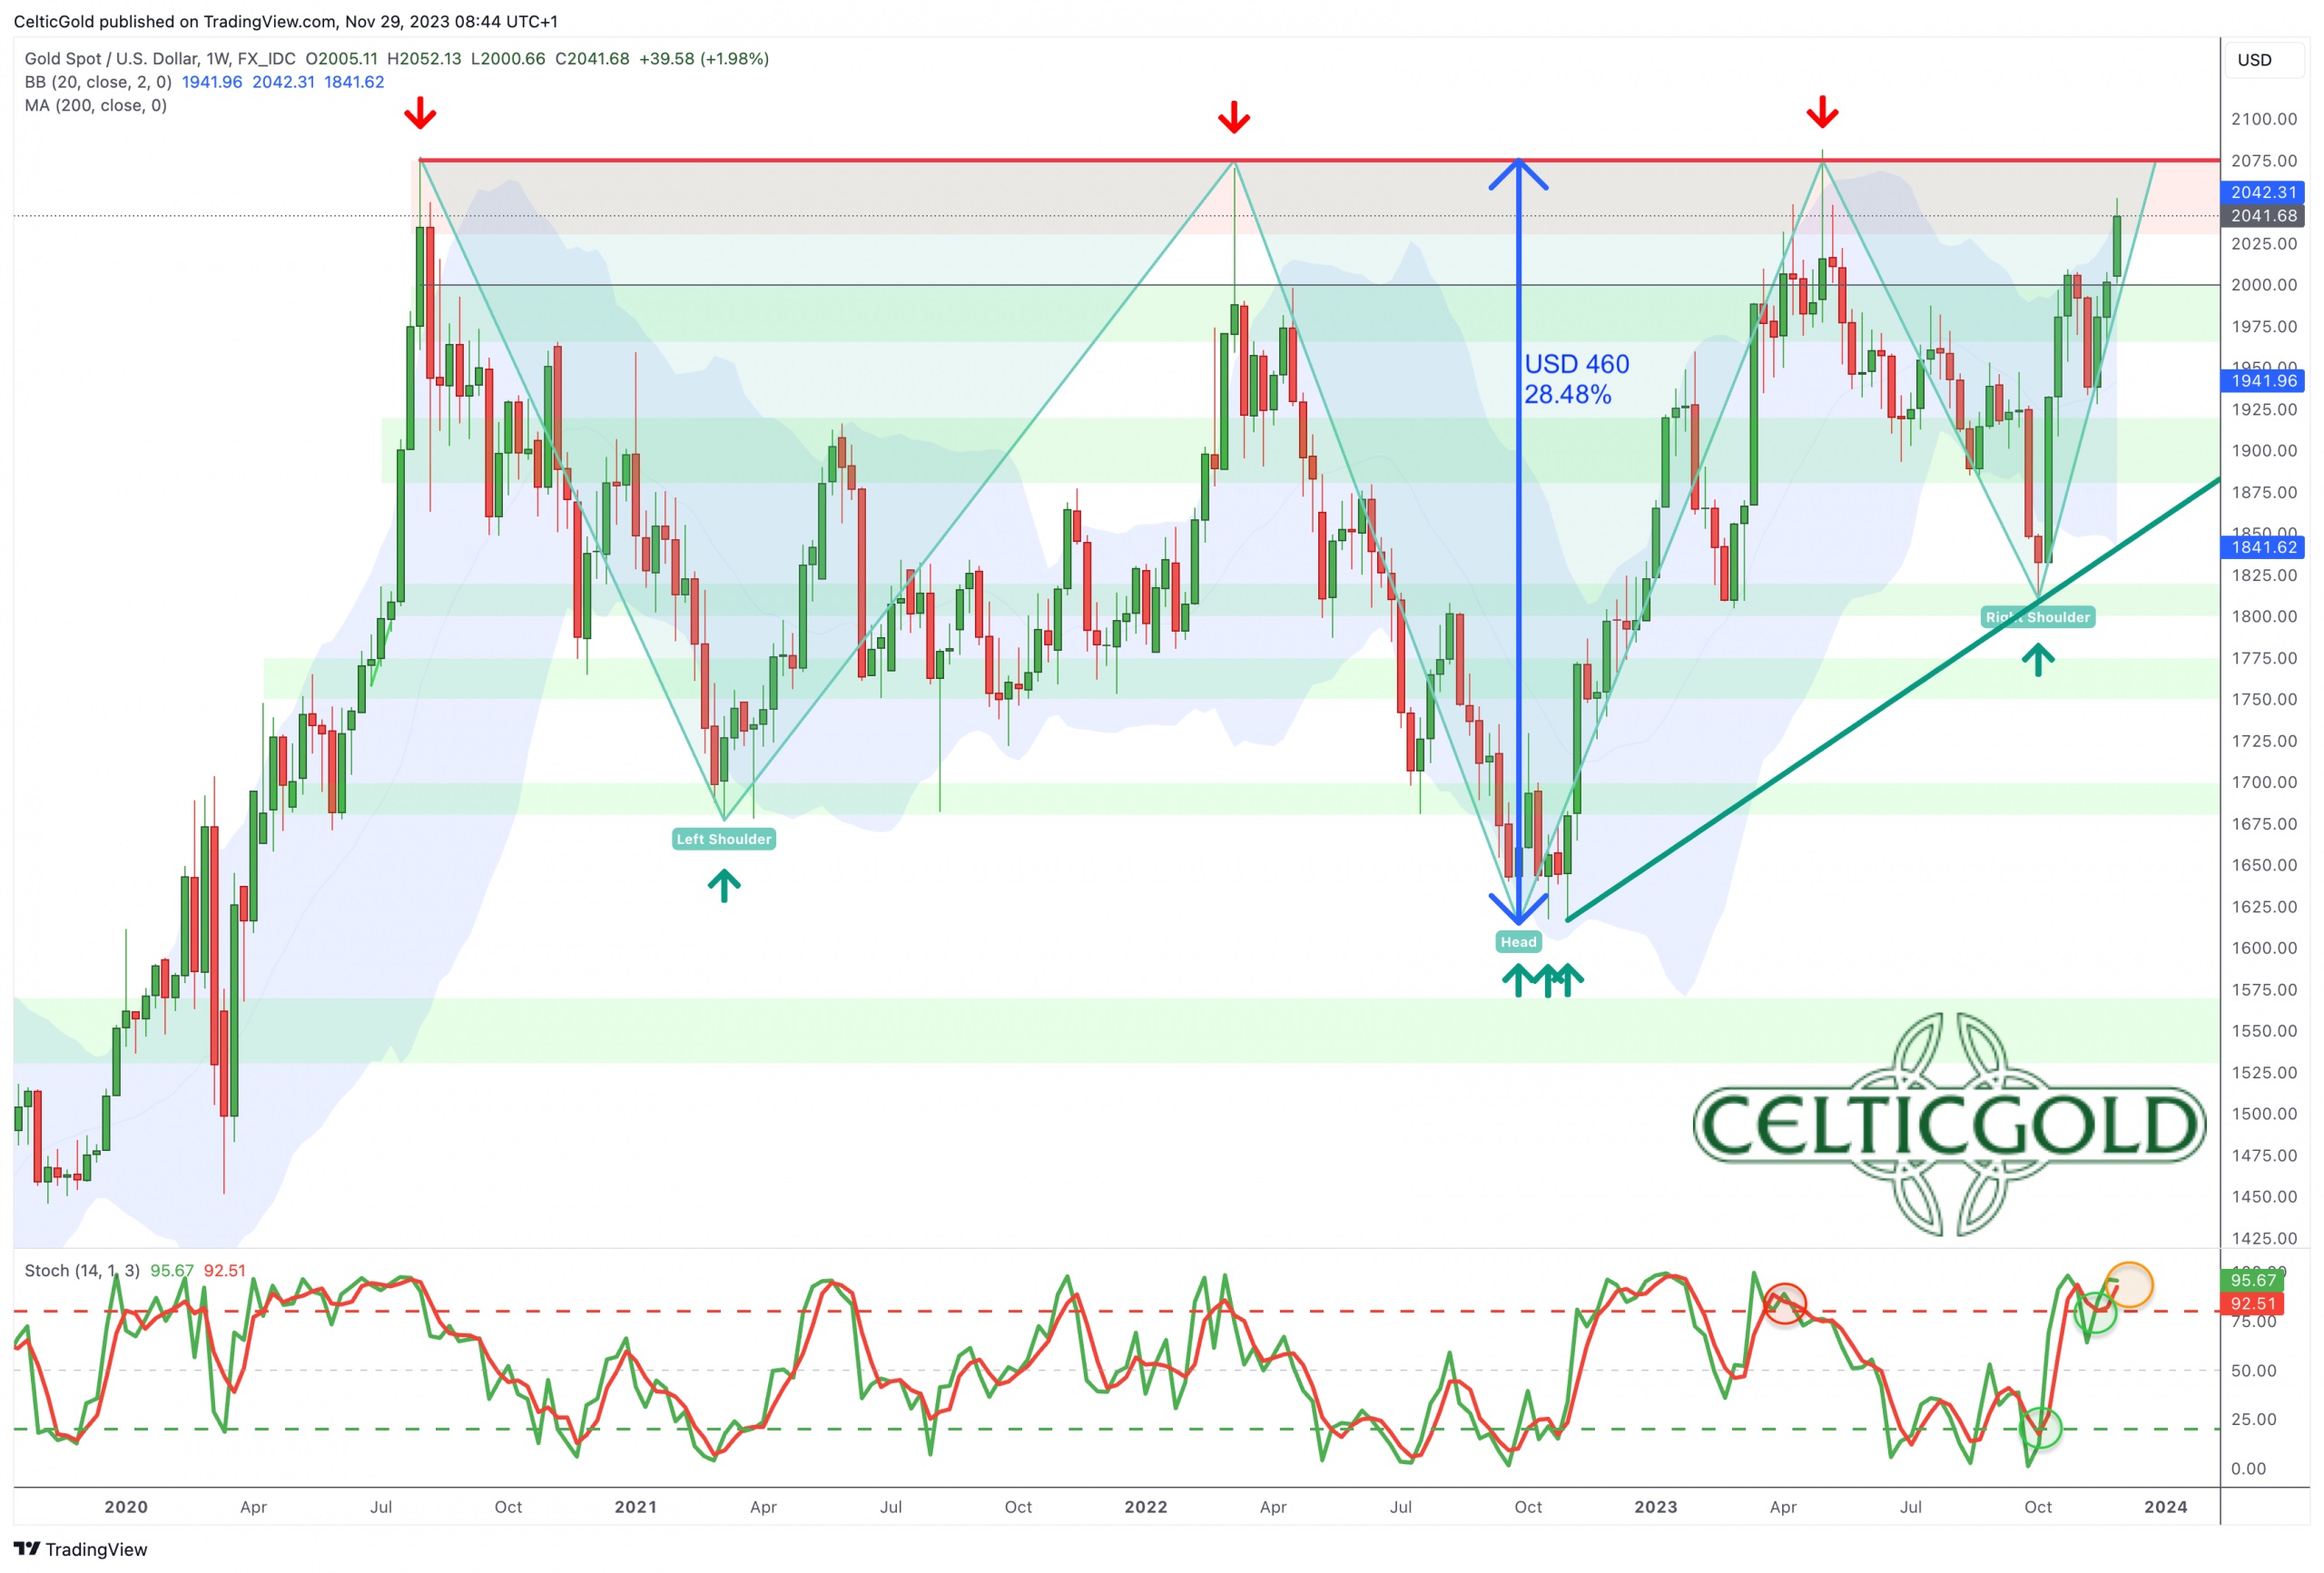
Gold in US-Dollar, weekly chart as of November 29th, 2023. Source: Tradingview
Owing to the strong bounce in October and the persistent approach towards the USD 2,000 level since then, the inverse head-and-shoulders formation on gold’s weekly chart appears to be on the verge of completion. Surprisingly, the right shoulder is rather shallow, which means that buyers were rather impatient coming into the market. All that is still missing would be the breakthrough and above the neckline at USD 2,075. Currently, gold needs to rally another USD 35 or +1.71%.
Given the clearly overbought weekly stochastic, legitimate doubts arise regarding this highly bullish perspective. Ideally, and despite the overbought conditions, gold prices would advance towards the neckline at USD 2,075 in the next one to three weeks. This would pave the way for a healthy “cooling-off” pullback from higher levels between approx. USD 2,075 to USD 2,125. For instance, a necessary recharging retracement could bring gold back down towards USD 2,000 to USD 2,025 for a final kiss & goodbye to this new support zone before the actual breakout rally might start in earnest. Contrary to our expectations, a clear failure at the neckline at USD 2,075 would necessitate a substantially larger right shoulder and extent the 3.5-year long consolidation.

Overall, the weekly chart is bullish, despite overbought conditions. Actually, the chart indicates a rather immediate rise to at least USD 2,075 by the end of December. If a breakout above the neckline at USD 2,075 would be successful as well, a theoretical target of approximately USD 2,535 can be derived from the difference between the head of the inverse head-and-shoulders formation at USD 1,615 and the neckline at USD 2,075. This target could be achieved within a few months, considering the compressed energy that has been accumulated over the last 12 years.
Daily chart: Close to break out
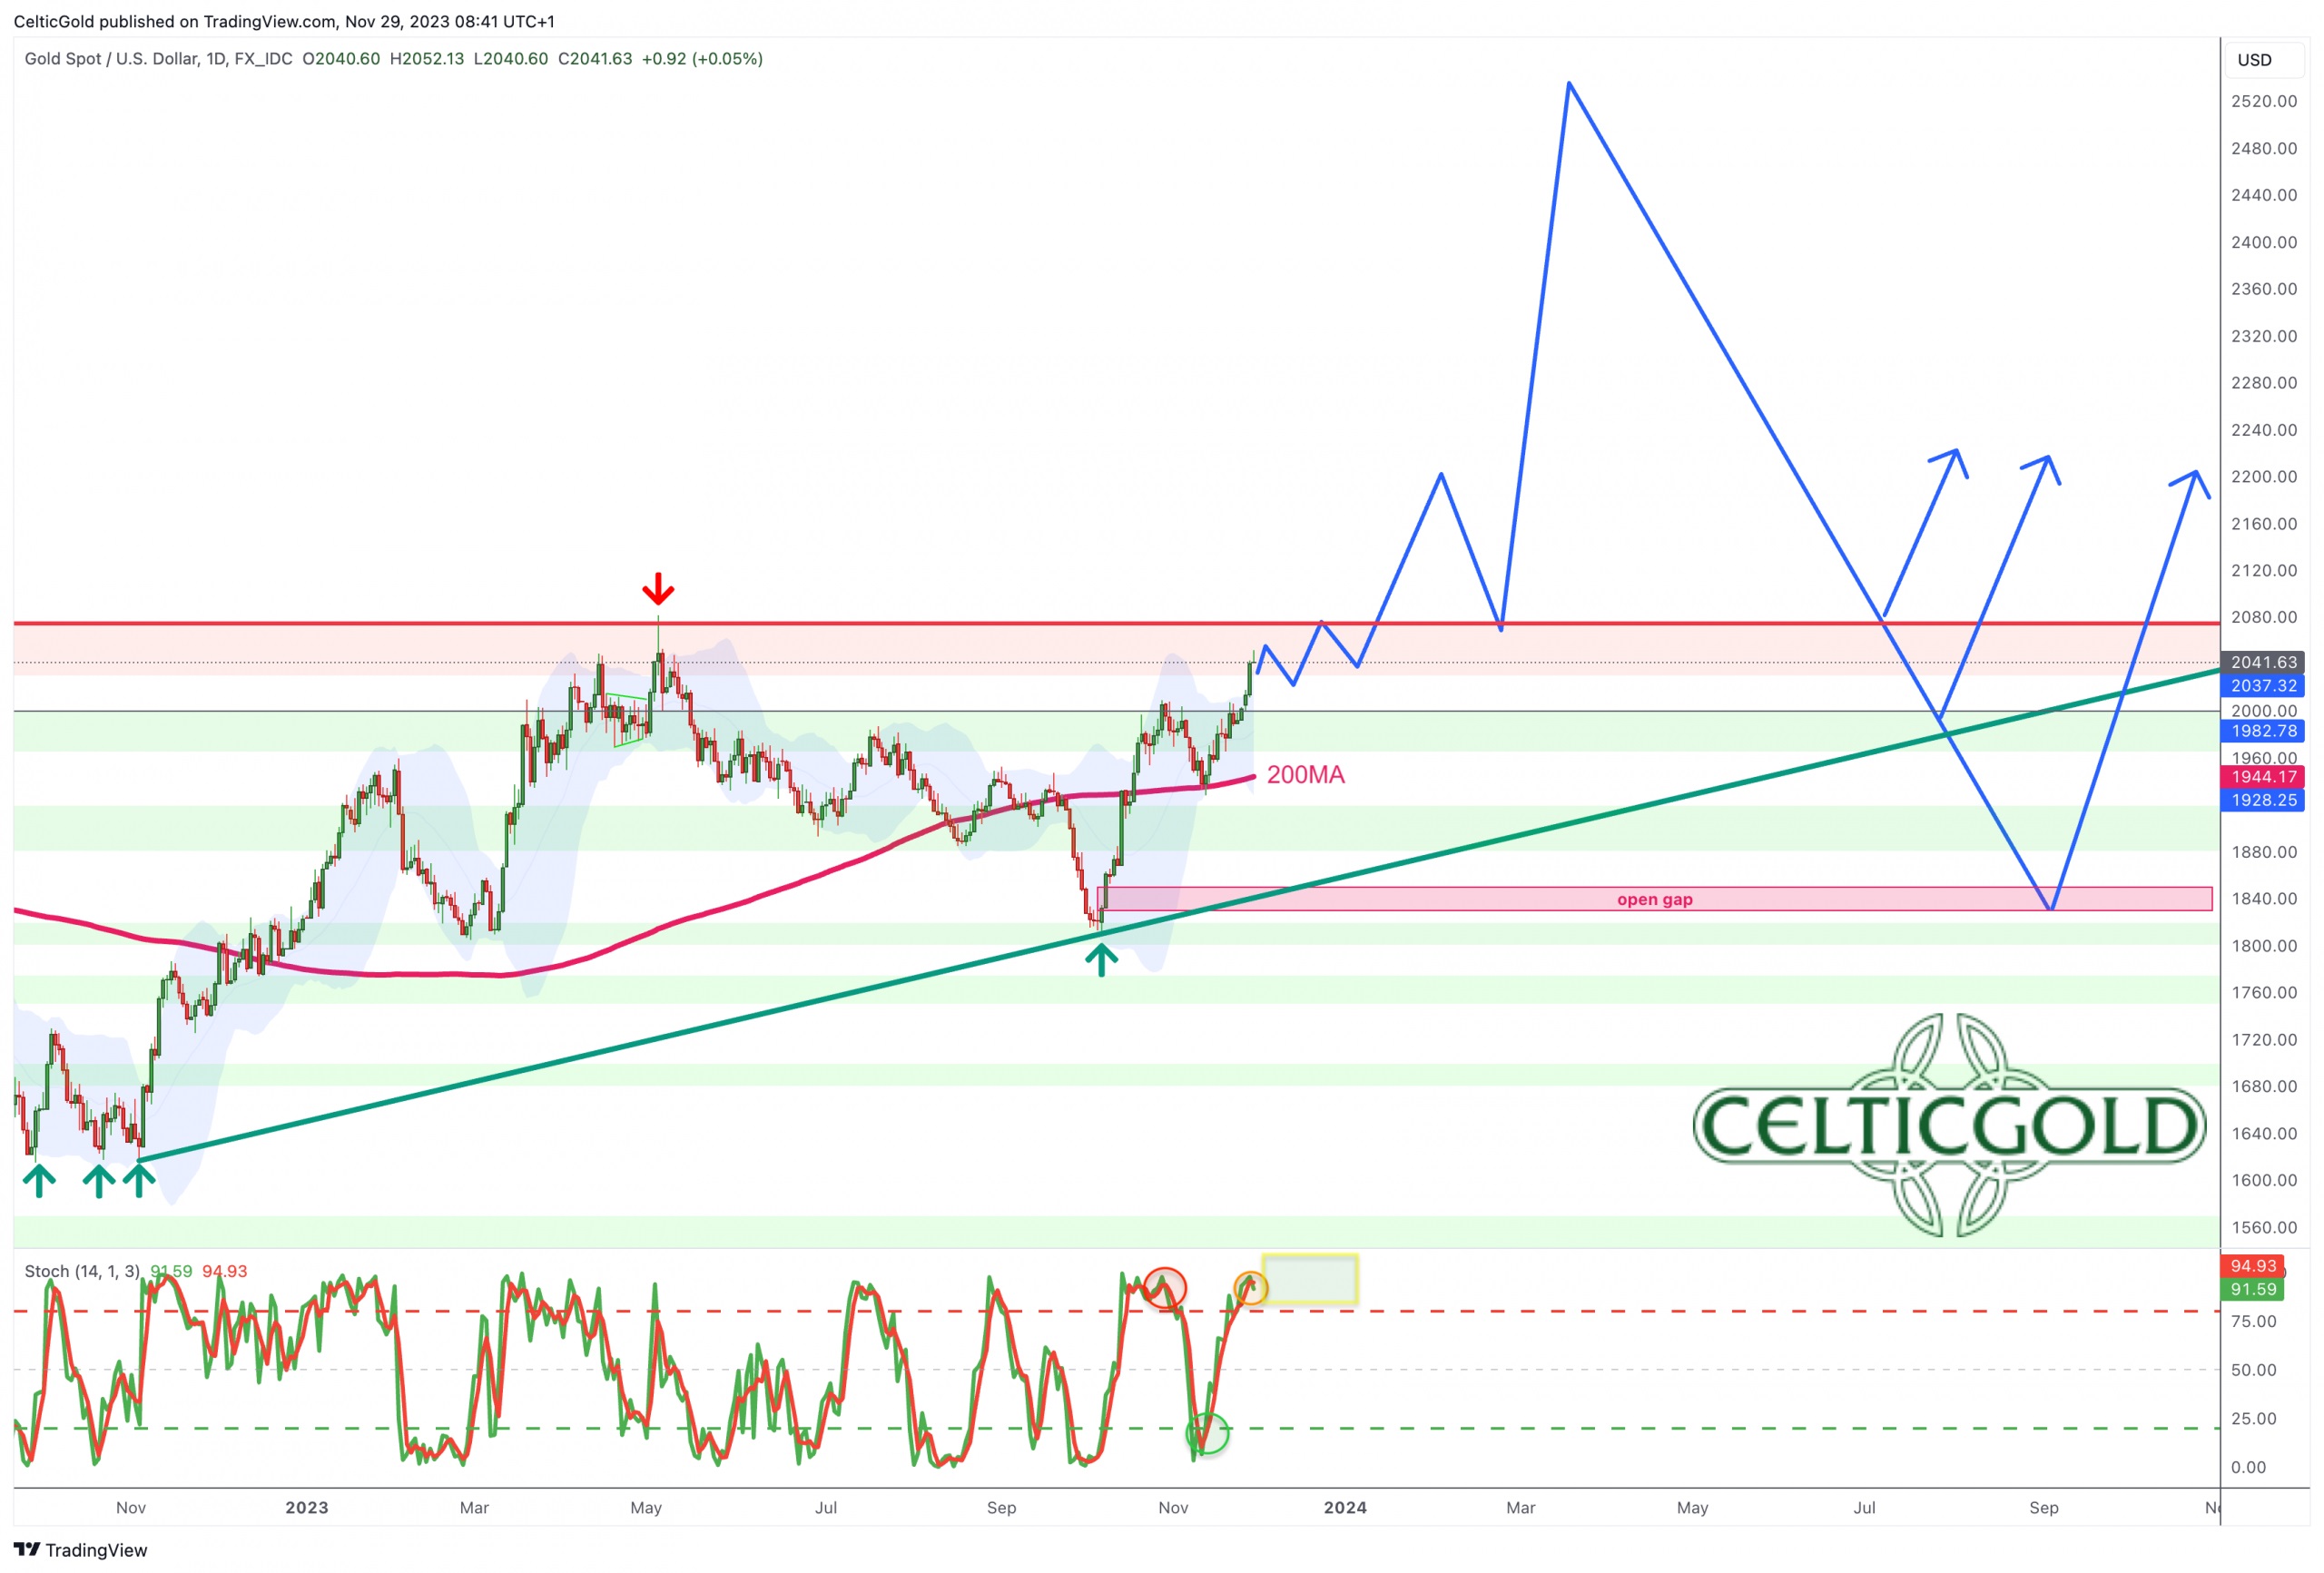
Gold in US-Dollar, daily chart as of November 29th, 2023. Source: Tradingview
On the daily chart, the 200-day moving average (USD 1,944) withstood the bearish assault two and a half weeks ago. Gold prices utilized this support as a springboard and have overcome the resistance zone around USD 2,000.
While the daily stochastic is significantly overbought, the oscillator is about to transform into an embedded super-bullish state. This would secure the uptrend, likely propelling prices towards USD 2,075 to USD 2,125 more or less directly. Alternatively, some form of a pullback might occur between the end of November and the next FED interest rate decision on December 13th. However, such a pullback should ideally hold above USD 2,000. The worst case would be another test of the rising 200-day moving average (USD 1,944).
The lingering concern is the open price gap (“Hamas Gap”) at USD 1,830. Typically, 80% of those price gaps are eventually closed. Currently, the expectation is for a sharp breakout rally first, before potential market disturbances in the second half of 2024 could compel a liquidity crisis, which could force gold prices downward to fill that open gap.
In summary, the daily chart is bullish but overbought. In the short term, the most critical factor is whether gold can maintain a monthly close above USD 2,000 by Thursday, November 30th. Success in this regard would indicate our most bullish scenario. Otherwise, a pullback should be anticipated.
Commitments of Traders for Gold – Increasingly Bearish
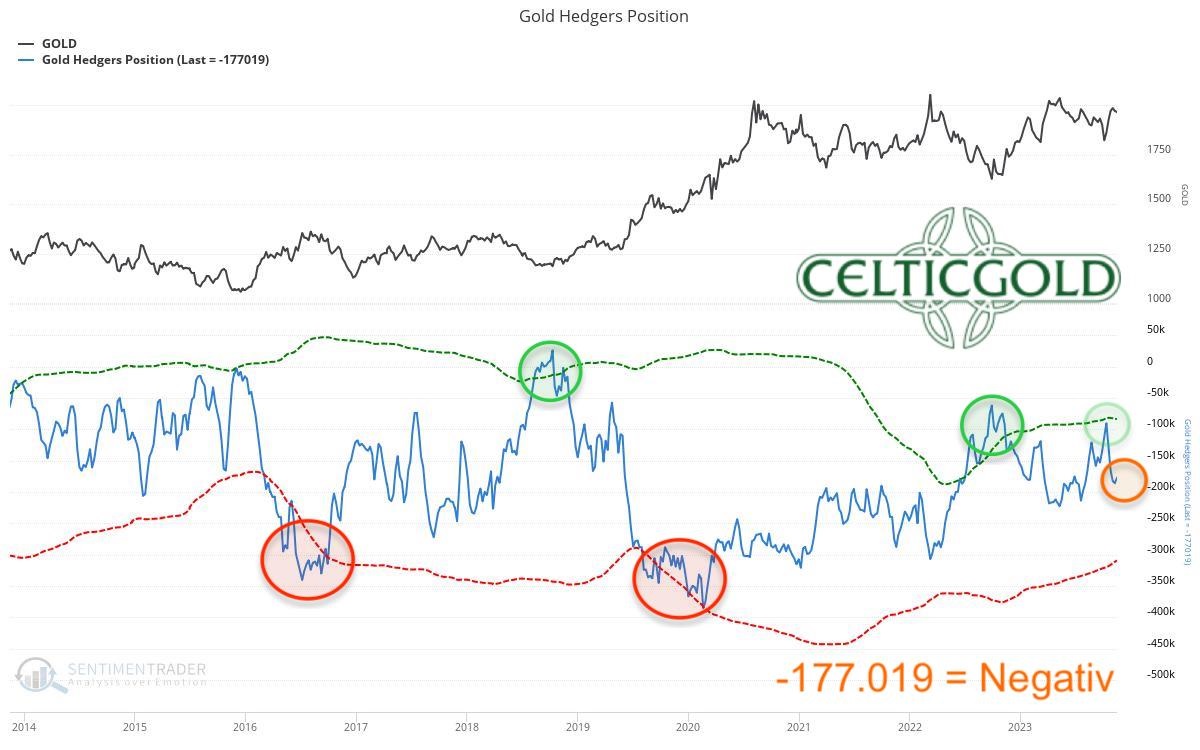
Commitments of Traders (COT) for gold as of November 24th, 2023. Source: Sentimentrader
In the Gold-Futures market, as of November 24th, and at a gold price of USD 1,965, commercial traders held a cumulative net short position of 177,019 future contracts. This indicates a clear deterioration due to the recent rally. However, there is still considerable room until an extreme scenario, in which commercial players have held up to 300,000 to 350,000 net short contracts in the past.
Overall, the current Commitments of Traders (CoT) report is increasingly bearish, potentially hindering a breakout above USD 2,075.
Sentiment for Gold – Neutral
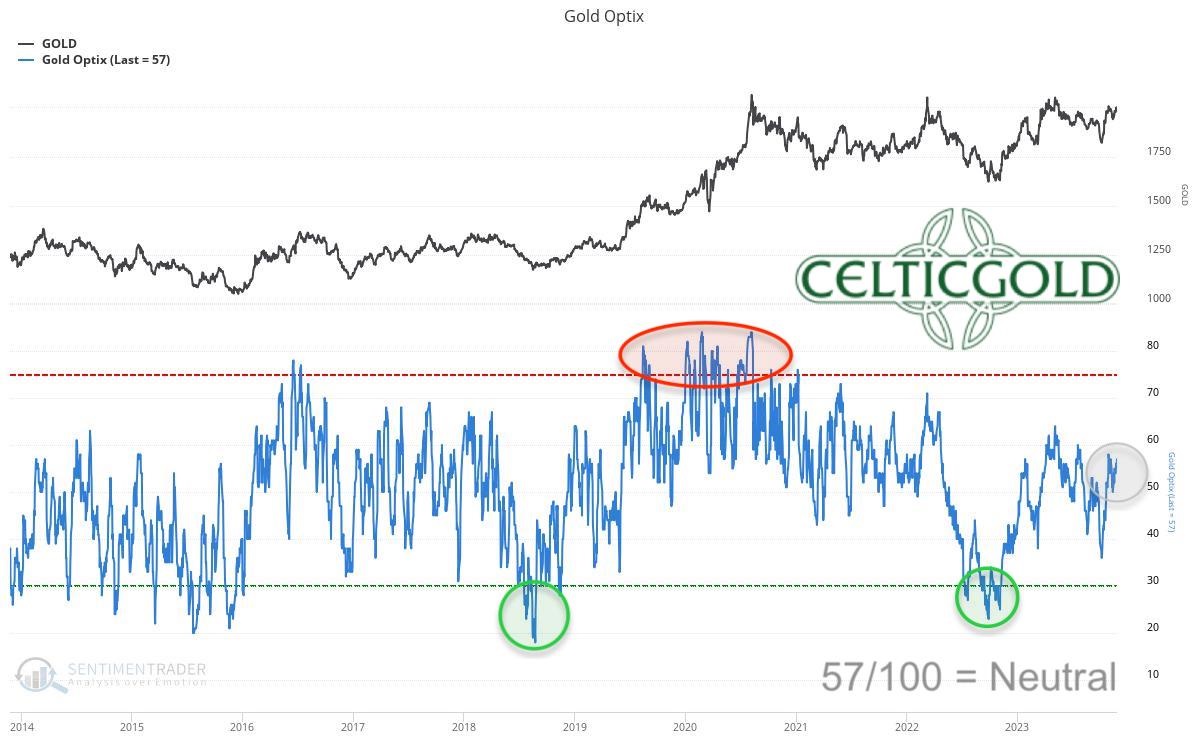
Sentiment Optix for gold as of November 24th, 2023. Source: Sentimentrader
With a value of 57, the Sentiment indicator continues to measure a rather neutral sentiment in the gold market. However, considering the temporary “bloodbath” phase and correction between September 20th and October 6th, a significant shift back towards pessimism is not expected anytime soon. On the contrary, the Sentiment indicator is currently well-positioned for our super-bullish breakout scenario.
Overall, sentiment in the gold market is neutral, providing ample room until an excessively euphoric phase.
Seasonality for Gold – Right In Front Of The Best Phase Of The Year
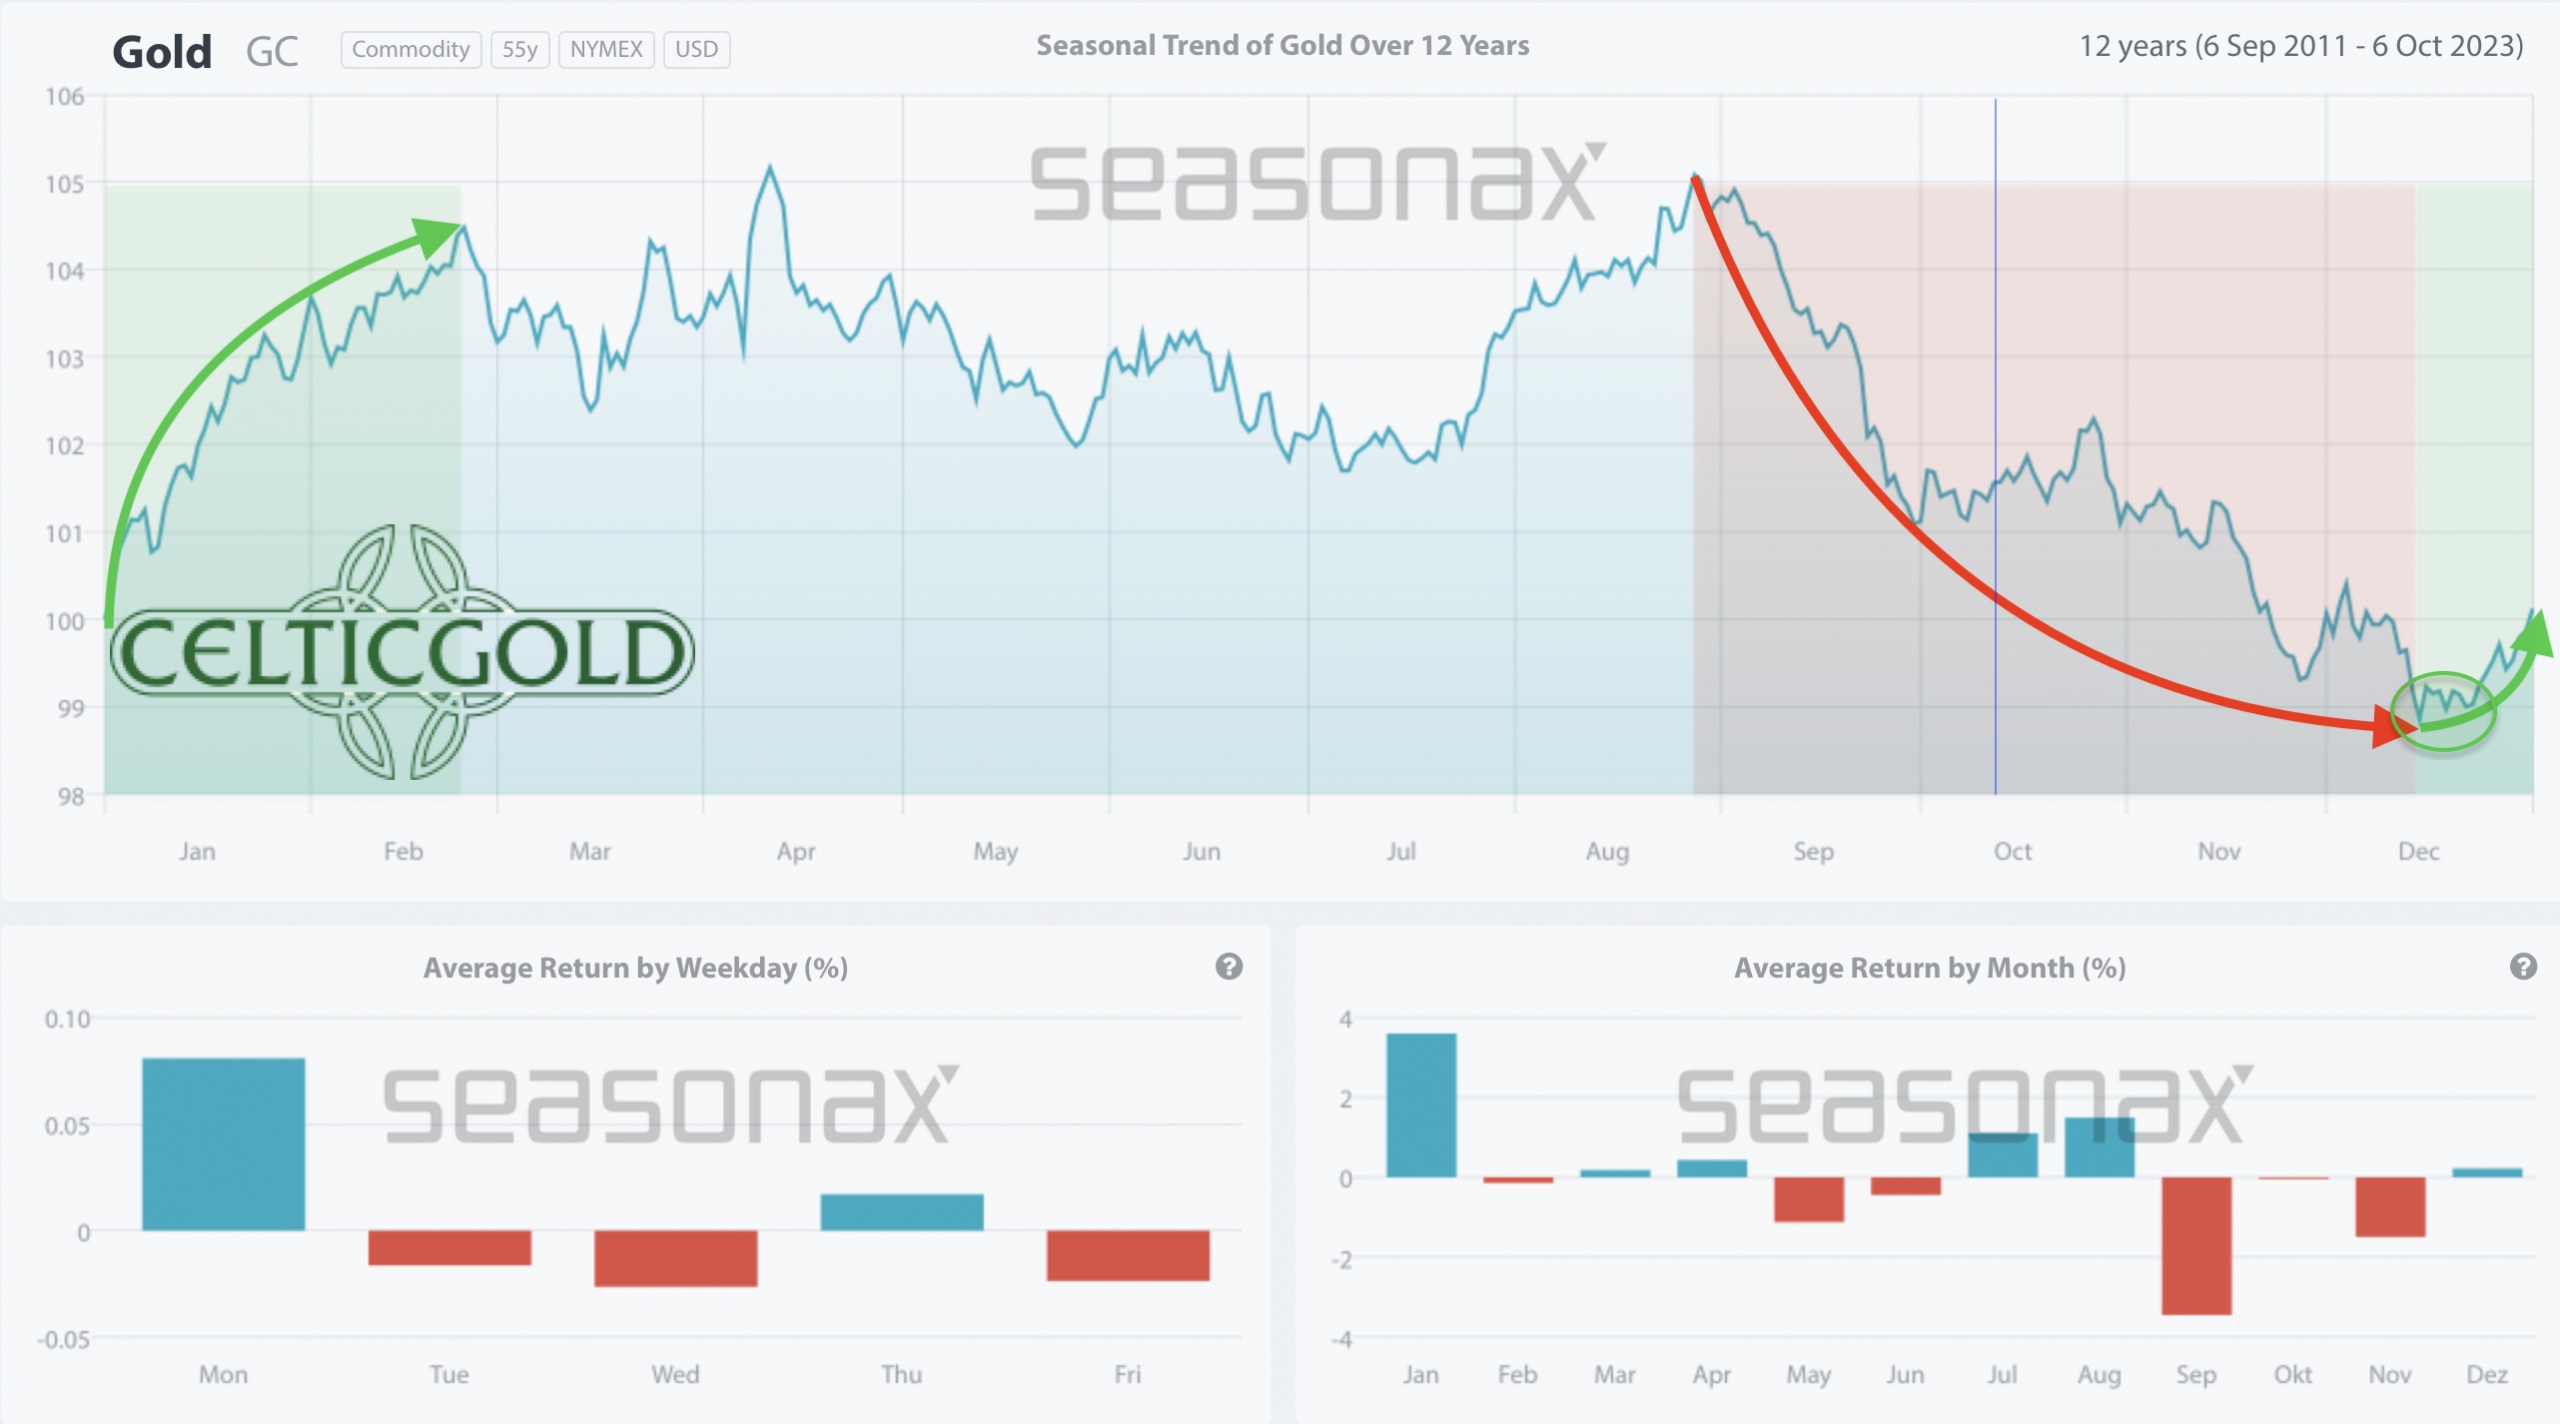
Seasonality for gold over the last 12-years as of October 9th, 2023. Source: Sentimentrader
Based on the seasonal average of the last 12 years, the gold market has two weeks remaining until the onset of an extremely positive phase between mid-December and late February. The time for being “fully invested” is now!
Over the past 12 years, the seasonal component from mid-December has been notably bullish, anticipating significant price increases.
Macro update – Central Banks with Strong Gold Demand
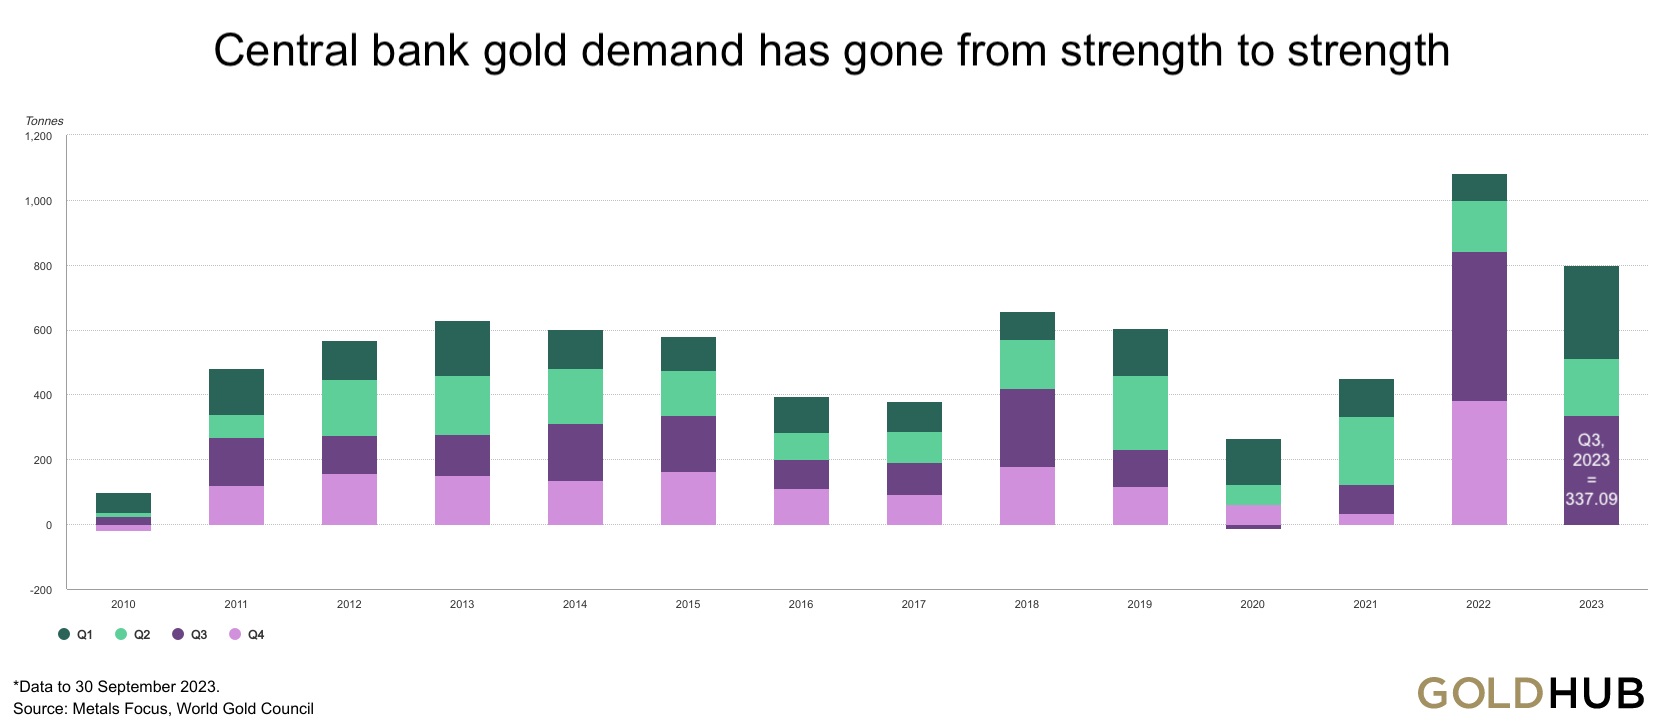
Central bank gold demand since 2010. Source: IMF IFS, Respective central banks, World Gold Council
While the AI boom, the potential approval of Bitcoin ETFs, a ceasefire in the Gaza Strip, and a year-end rally have brought hope and relief to financial markets, central banks’ net gold purchases this year are approximately 14% higher than those in 2022. Central banks have collectively bought around 800 tons of gold so far, an unprecedented amount for this nine-month period.
The spectrum of countries whose central banks have bolstered their reserves in recent quarters is broad. The 33 most important central banks, led by China (78 tons), Poland (57 tons), Turkey (39 tons), and India (9 tons), purchased a total of 197.85 tons of gold in the third quarter of 2023, averaging 66 tons per month.
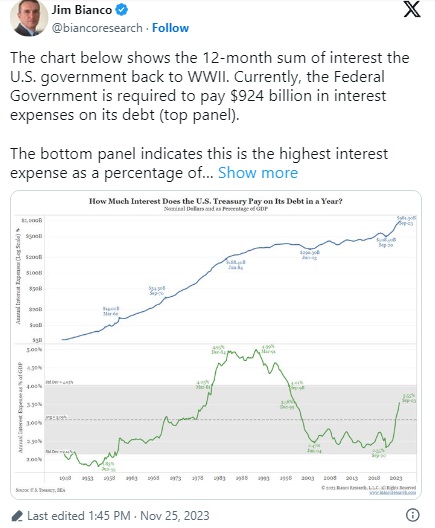
The reasons for the increased central bank demand are diverse and partly individual. Primarily, it is likely attributed to the general high uncertainty, geopolitics, and heightened volatility in bond markets, along with the exponentially rising US national debt and US interest payments.
Economic Sanctions Accelerate De-dollarization
Geopolitics have clearly divided into two blocs (East and West) since the Russian attack on Ukraine. Hence, globalization is in retreat. Many nations, alarmed by economic sanctions against Russia, are striving to diversify their currency reserves and seek alternatives to the US dollar, whose backing by the Saudi oil trade (Petrodollar) is gradually weakening.
High Volatility in Bond Markets
Simultaneously, volatility in bond markets remains significantly elevated compared to the last 20 years. For instance, the yield of 10-year US Treasury bonds fluctuated over 13%, decreasing from 5.02% to 4.37% in the last four weeks. These are substantial movements, which create lots of challenges for central banks and institutional investors in the fixed-income segment of their portfolios.
However, the concerns about the sustainability of the US debt trajectory are likely the primary drivers of continued rising gold demand from central banks. The soaring debt ratios and escalating interest costs, expected to consume 20% of government tax revenues by 2024, signal imminent challenges for US dollar holders and those with US dollar-denominated debts.
First Interest Rate Cut in May 2024?
Currently, the markets anticipate that the Federal Reserve Bank will no longer raise interest rates in December but will present the first interest rate cut in May. It is crucial to understand that the Fed follows with some delay the markets and not vice versa. If a recession and economic disruptions (“crash landing”) become more apparent, despite elevated inflation, the Fed might be compelled to implement substantial interest rate cuts due to market pressure. This is likely to weigh heavily on the US dollar and concurrently boost gold prices. Markets typically factor in such developments approximately six months in advance.
The macroeconomic environment remains extremely favorable for the gold price.
Conclusion: Gold – Monthly Closing Above USD 2,000 Triggers Breakout Rally
Gold is on the verge of its first monthly closing above USD 2,000. If achieved by the end of November, an initial surge to the all-time high around USD 2,075 is expected to follow. As each attempt to breach a resistance level weakens its resistance, the fourth or, at the latest, the fifth attempt at the all-time high should result in a successful breakthrough.
The subsequent breakout rally is likely to be spectacular, like the one in 2009, considering the significant energy accumulated in the gold market over the past 12 years. As outlined, the chances are high that gold prices could increase by approximately 20 to 25% by spring 2024 in this very bullish scenario. To realize this scenario, any retracements from now on should find support, at the latest, at the quickly rising 200-day moving average (USD 1,944 USD). But ideally, gold will not fall back below USD 2,000 anymore in the coming few weeks.
“Gold – Monthly Closing Above USD 2,000 Triggers Breakout Rally” – analysis initially published on November 26th, 2023, by www.celticgold.de. Translated into English and partially updated on November 29th, 2023.
 Florian Grummes (born 1975 in Munich) has been studying and trading the Gold market since 2003. In 2008 he started publishing a bi-weekly extensive gold analysis containing technical chart analysis as well as fundamental and sentiment analysis. Parallel to his trading business he is also a very creative & successful composer, songwriter and music producer. You can reach Florian at: [email protected].


