Gold Moving Back Into Topping Range


Last week's trading saw gold forming its bottom in Monday's session, here doing so with the tag of the 1781.20 figure. From there, a rally was seen into a mid-week high, with the metal pushing all the way up to a peak of 1829.80 - before backing off the same into late-day Friday.
Gold's Near-Term View
For the very short-term, the most dominant cycle that we track is the 34-day wave, which is shown again on the chart below:
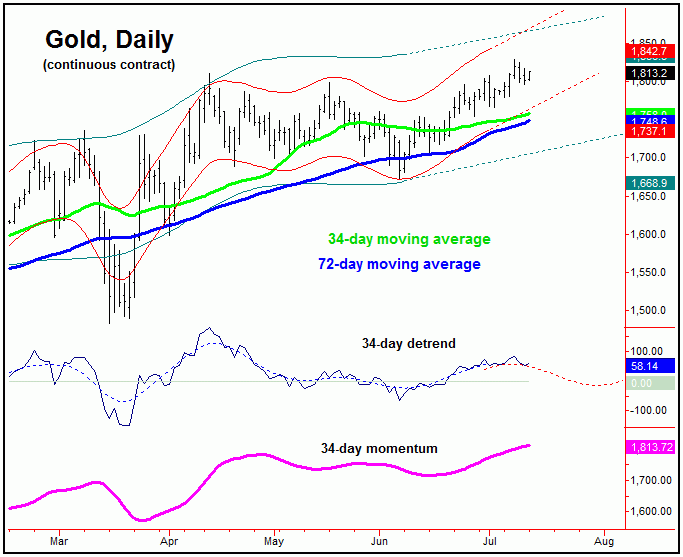
In terms of time, our 34-day wave is some 25 trading days along to the upside, and with that is moving back into topping range. The current upward phase of this wave is seen as the odds-on favorite to top the larger 72 and 154-day cycles, for what is expected to be another correction phase into the month of August.
From my 7/5/20 article: "On our 72-day chart, the channels that track this wave are now turning higher, which is supportive of the current upward phase - and suggests more strength to come. In terms of patterns, we noted that any short-term correction phases - such as seen with the smaller-degree waves that we track (i.e., 10 and 20-day) should be expected to end up as countertrend. And, if correct, higher highs would follow with the upward phase of this larger 72-day component."
From the comments made in recent weeks, the upward phase of the 72-day cycle was seen as being back in force, which suggested that new highs would be seen for gold - and that any short-term correction phases would end up as countertrend. Here again is our 72-day component:
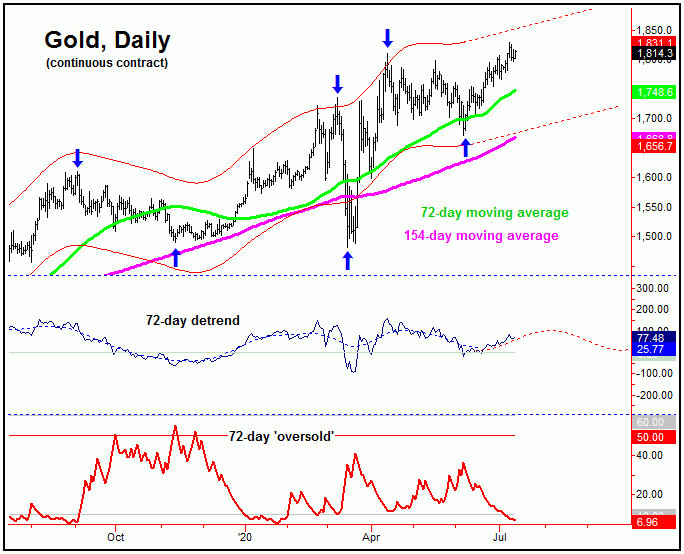
On this chart, we can see that we are moving towards the upper channel line, and with that will need to be on the lookout for technical signs of a peak forming - since the larger 154-day wave is also looking for its top. Here is our larger 154-day wave:
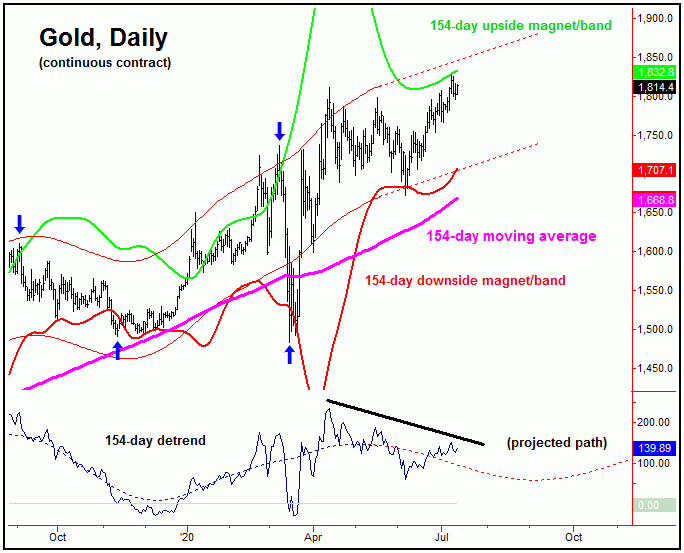
In looking at our 154-day chart, of particular interest is that our detrend indicator (lowest pane) is now diverging from the recent new high in price - which is viewed as a technical negative. This is something seen closer to tops for this wave, and, particularly, when the metal is able to see a daily close above its upper 154-day magnet/band line (here, 1832 and rising).
Stepping back, once the next peak is in place for the 154-day wave, then the odds will favor a decent correction playing out into August, one which sees the 154-day moving average and/or 154-day down magnet/band acting as the target. In terms of patterns, however, that move down is expected to end up as a countertrend affair - within a larger bull market. If correct, this should give way to higher highs on the next swing up with this wave into later this year. More exact details of precisely when we expect the next 154-day peak to occur are noted in our Gold Wave Trader market report.
Technical Considerations
In looking at other technical indications, our Mid-Term Breadth index is still pointing higher, but is starting to form a divergence against the new price high. Take a look:
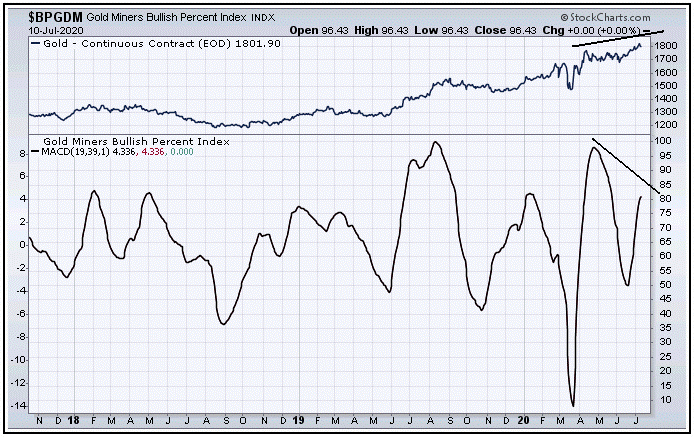
As mentioned in past weeks, the turn up in our Mid-Term Breadth index was viewed as bullish - and was supportive of additional strength, which we have obviously seen. Having said that, with the indicator starting to show a divergence against price action, we have to be on the lookout for signs of a top going forward.
Even with the near-term bearish indications for gold, we are looking for the next decline phase of the 72 and 154-day cycles to end up as a countertrend affair. And, with the larger trend projected to remain higher into later this year, that means we should be looking to buy this correction, if and when seen.
The Larger View for Gold
For the bigger picture, as mentioned many times in my prior articles, we are targeting the round-2000 figure as our ultimate target for later this year. This target comes from the inverted 'head & shoulder' pattern, which is shown on our 310-day cycle chart:
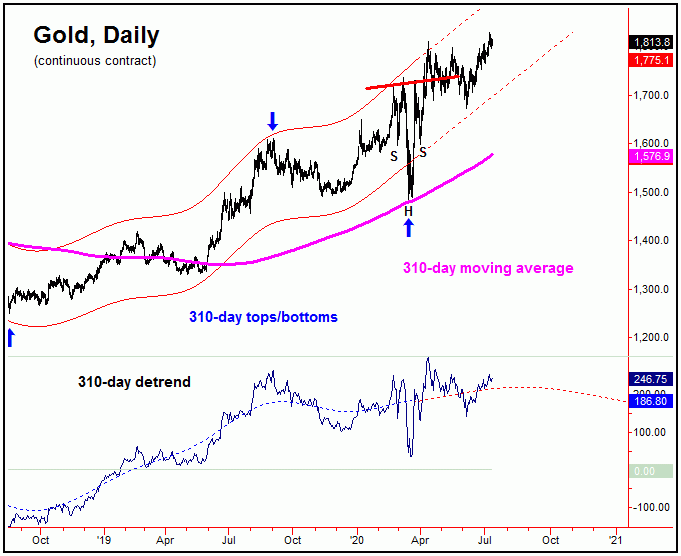
The next mid-term peak is expected to come from this 310-day cycle, with the next larger-degree high expected to come from the four-year cycle, with the former expected to come sometime later this year. From that high, a multi-month decline is expected to play out into the Spring of next year, a move which is also expected to end up as another countertrend affair.
U.S. Stock Market
In looking at the U.S. stock market, as mentioned in prior articles the downward phase of the 45 and 90-day cycles was seen as in force, with the second largest percentage decline of the year expected to play out. That decline took the SPX down from a high of 3233.13 to a low of 2965.66, which was the second largest percentage decline of the year for U.S. stocks. Take a look at our next chart:
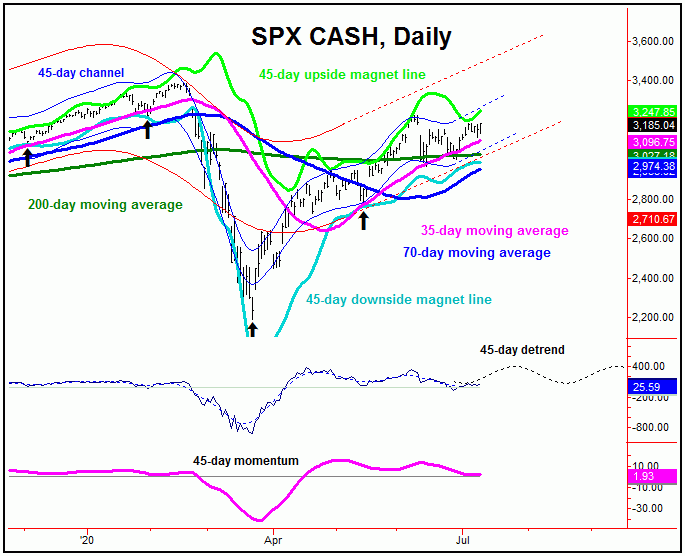
With the action seen into early last week, we were able to confirm a bottom in place with our 45-day cycle. In terms of price, the suggestions with this wave call for a potential move up to the 3260-3280's on the SPX in the coming weeks, where we will need to be looking for signs of another top forming. From that high, as per the gold market we are looking for a decent correction to play out into the month of August, though we expect that decline to end up as a countertrend affair.
If the above assessment is correct with the 45-day cycle, higher highs should continue to play out into later this year, before topping our next larger wave, the 180-day cycle:
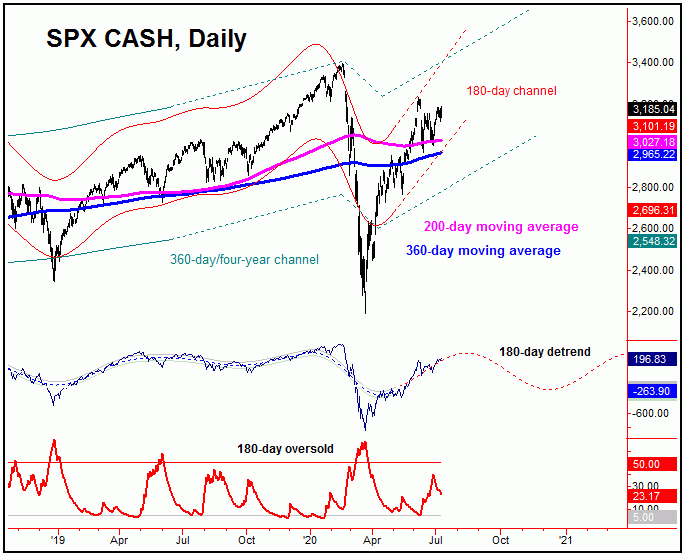
Going further with the above, the lower 180-day channel line should provide key support to any short-term correction phase - such as the one into August, with the smaller 45-day wave.
The Bottom Line
The overall bottom line with the above is that gold's 34-day, 72-day, and 154-day upward phase is still deemed to be in force, but which is moving back into normal topping range. From whatever high that forms with these waves, we are looking for a decent percentage decline in the weeks to follow, a move which is expected to end up as countertrend - against the larger bull market in gold. As for U.S. stocks, our ideal path has the current rally phase holding up into later this month, before also giving way to an August correction. Stay tuned.
Jim Curry
The Gold Wave Trader
http://goldwavetrader.com/
http://cyclewave.homestead.com/
More from Gold-Eagle


