Gold Nonplussed By Scary And Crazy


Let's start with Scary, (apropos of Halloween): Thursday brought us our first peek at StateSide annualized Gross Domestic Product "growth" for Q3: 2.0%. That's cute and cuddly and feels back to normal, right? Until one takes into account the Chain Deflator -- 5.7% -- which divided into the GDP reduces "real growth" to its 11th weakest of the 246 quarters recorded since the turn of the millennium. Now here's the Scary bit: of those 10 other weakest quarters, six of them led and carried into either the DotCom Crash of 2001-2002 or the FinCrisis of 2008-2009. Just in case you're scoring at home.
That noted, we just completed 2021's "Crash Season" for the S&P 500: and as typically is the case, again there was no crash. Neither came our "Look Ma! No Earnings!" crash, nor FedGov Lael "The Brain" Brainard's "Climate Change!" crash. Thus for the stock market, enter complacency and the Santa Claus Rally. We feel festive all over. Why, just look at that S&P: right there at an all-time closing high of 4605, with our "live" price/earnings ratio at 53.1x, a mere 206% above its lifetime median, even as 80% of S&P Q3 Earnings are higher than those of a year ago.
"Well, mmb, we're all taught in school that the stock market is a hedge against inflation..."
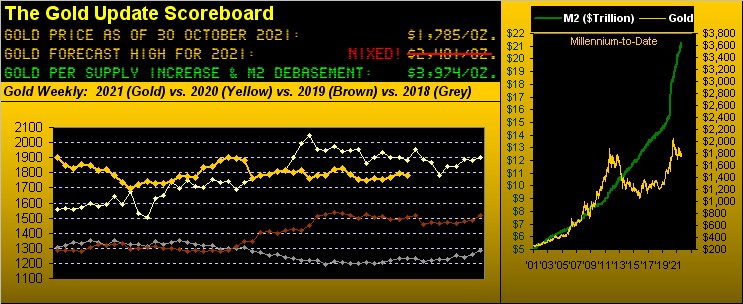
To your point, Squire: as measured through today from 24 February 2020 -- when COVID really began ballooning and, in reaction, currency debasement really began ensuing -- both the StateSide Money Supply (per "M2") and the S&P 500 are identically +38%. How perfect is that?
All that monetary infusion into the U.S. economy to save the nation... and yet as measured by said percentage, it all ended up in the stock market. Thus by the "school rule", has your cost of living across that timeframe also increased by a like 38%? 'Tis a fair question. Per this California example from an esteemed member of our Investors Roundtable: "A year ago it cost me $70 to fill up my truck; today it cost me $107." (True, that is actually a 53% increase, but as we'll below see in our BEGOS Markets Standings, the price of Oil from a year-to-date is leading the pack even more so +72%).
Let's also assess Crazy, (apropos of inflation). The buzz 'round the FinMedia circuit and beyond is inflation, and some say hyper-inflation![]() . "The Dollar is finished! It is El Post-Toasties! Gold is going to explode!" 'Cept here's the Crazy bit: the Dollar is doing just fine. Year-to-date the Dollar Index is +4.6%. And Gold is -6.1%. That suggests DEflation, right? Crazy indeed. So nonplussed is our pal Gold ... or as Rodgers and Hart put it:
. "The Dollar is finished! It is El Post-Toasties! Gold is going to explode!" 'Cept here's the Crazy bit: the Dollar is doing just fine. Year-to-date the Dollar Index is +4.6%. And Gold is -6.1%. That suggests DEflation, right? Crazy indeed. So nonplussed is our pal Gold ... or as Rodgers and Hart put it: ![]() "Bewitched, bothered and bewildered..."
"Bewitched, bothered and bewildered..."![]() --[Pal Joey, '40]
--[Pal Joey, '40]
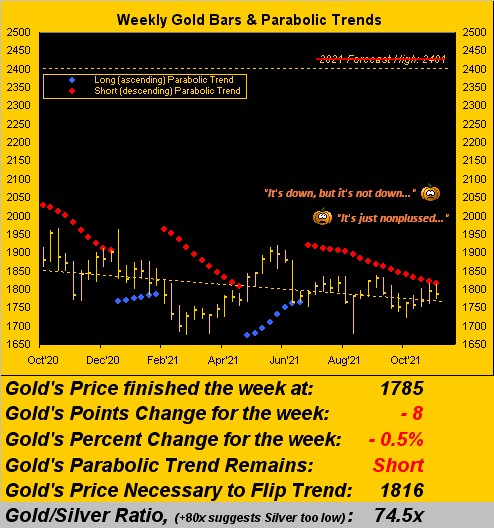
Regardless, Gold settled out the week yesterday (Friday) at 1785. And yes again (again, again), 'twas the fourth consecutive Friday wherein the price of Gold suddenly out of nowhere got clobbered, be it by the M word crowd or otherwise. In fact for you WestPalmBeachers down there, that's your new 100% reliable trading system: sell Gold on Thursday's closes and cover on Friday's closes. To quote tennis legend Vic Braden: "You'll be famous by Friday!" ('Cept that shorting Gold is a bad idea). Nonetheless for Gold, 'twas another week and another nothing-burger. Thus per the below chart of Gold's weekly bars from a year ago-to-date, the ongoing re-dotted parabolic Short trend just recorded its 18th week, tying it for fifth in duration this century. Yet price today (1785) is but three points below where the trend began (1788) back on 02 July. Reprise: shorting Gold is a bad idea. Here's the graphic:
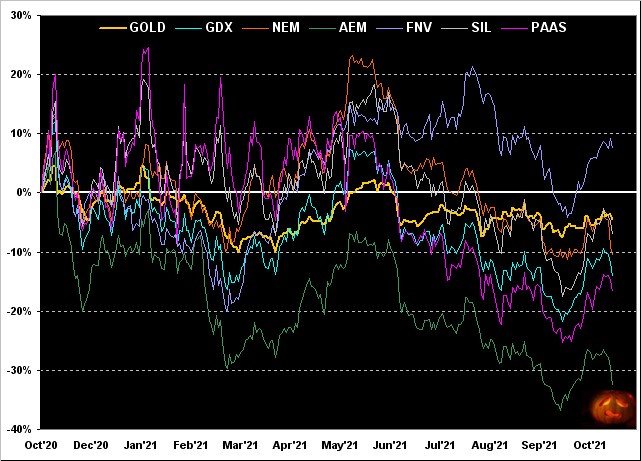
'Course as to where the leverage is, it being month-end, let's also go year-over-year with Gold and six of its high-profile precious metals equities brethren. And here, leverage really is the name of this roller-coaster game: Gold's price from this time last year to now as measured from low-to-high covers a range of 16%; however, the average such range for the six stocks shown is 52%; that's the 3x factor "expected" from the equities. But as to the specific net performance of this group, from best-to-worst we've Franco-Nevada (FNV) +7%, Gold itself -4%, the Global X Silver Miners exchange-traded fund (SIL) -7%, Newmont (NEM) -11%, the VanEck Vectors Gold Miners exchange-traded fund (GDX) -14%, Pan American Silver (PAAS) -17%, and Agnico Eagle Mines (AEM) -33%. Not the happiest Halloween-to-Halloween we've historically seen:
As to the aforementioned BEGOS Markets' Standings, here they are with 10 completed months in 2021's books. Indeed from the "20/20 Hindsight Dept." per year-end of 2020, had you purchased one Oil contract in a $10,000 futures account, its balance today would be $44,800. Hyper-leverage, that. (And please, no bits**t e-mails; rather, remain calm in your basement and don't forget to water the tulips in the vase next to your pet rock):
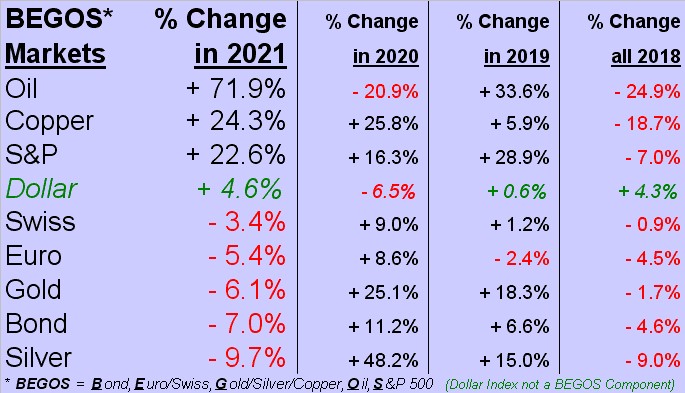
Speaking of basements, that's where in the above Standings at present find Silver, her daily Parabolics having just flipped from Long-to-Short per yesterday's settle. We root as hard for Sister Silver as anyone, but should the "average" price adversity of this fresh signal play out, the white metal (today 23.965) would revisit the mid-to-low 22s during November. And from a seasonal perspective, 12 of Silver's 20 Novembers from 2001-to-date have been down months, including all of the last eight Novembers (2013-2020): may that trend please come to an end!
We thus far discussed Scary and Crazy and leverage too. Now let's go economics and talk divergence. That in fact could be yet another designated crash: the "Divergence!" crash. A real jaw-dropper this one; have a look:
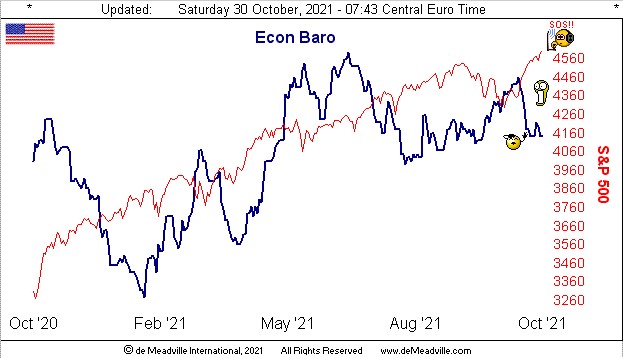
Indeed 'twas another weak week for the Economic Barometer, but not without some positives: There were marked improvements for October in the Chicago Purchasing Managers Index and the Conference Board's Consumer Confidence level, as well as a pickup in New Home Sales for September. But then came the bad "but": September's Pending Home Sales shrank; so did the month's Durable Orders; as well did Personal Income, with Personal Spending thus slowing. Then we've the afore-analyzed Q3 GDP, its "real growth" mitigated by the Chain Deflator. But then came another good "but", by which the Federal Reserve can do its happy dance: for the Fed's favoured gauge of inflation -- Core Personal Consumption Expenditures Prices -- was for September its most benign increase since February. ![]() "I can see you dance away now, uh-oh, uh-uh-ohh..."
"I can see you dance away now, uh-oh, uh-uh-ohh..."![]() --[Roxette, '79]. Perhaps a Fed official could kindly ask Wallflower Gold for a dance; (shan't hold our breath).
--[Roxette, '79]. Perhaps a Fed official could kindly ask Wallflower Gold for a dance; (shan't hold our breath).
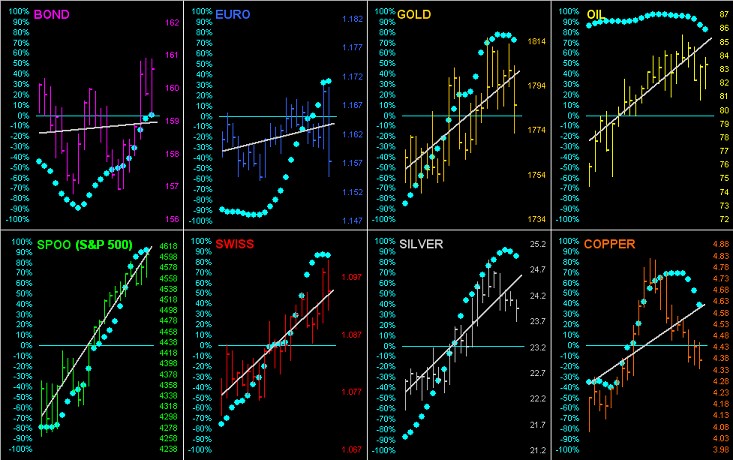
Yet here's something to leave one breathless. As we go 'round the horn across the past 21 trading days (one month) for all eight BEGOS Markets, there's not a negative linear regression grey trendline in the bunch. "Everything's up!" We'll see what the baby blue dots of each trend's consistency have to say about that:
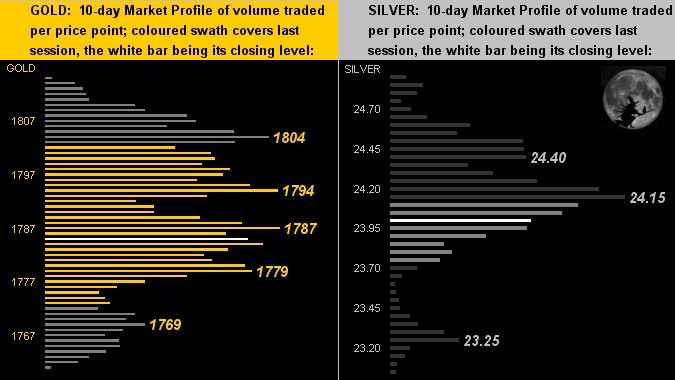
Then, too, specific to the precious metals we've their 10-day Market Profiles. For Gold on the left as we wrote a week ago, the yellow metal's price continues to chart a congestive mess. For dear old Sister Silver on the right, especially in the context of her aforementioned daily parabolic trend now having flipped to Short, regaining the 24s over the near-term looks to be a bit of a scrabble; bewitched indeed:
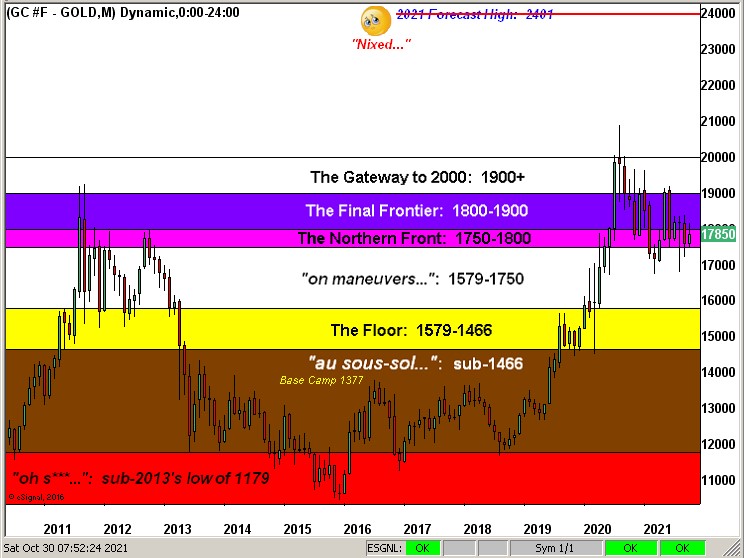
So with another month in the books we go to our graphic of the Gold Structure from some 11 years ago-to-date. That wee rightmost bar is the entirety of Gold's October: by percentage between the low and high the narrowest month since May 2019. And moreover from the "Déjà Vu Dept." 'tis really the battle all over again for The Northern Front as we saw nearly a decade ago, the StateSide Money Supply then essentially half what 'tis today. As our great and good colleague here wrote earlier this morning: "I have no words!!" ... (which is why yours truly pens The Gold Update):
Words, indeed: Scary, Crazy, leverage, divergence. Here's one more for the road: Wednesday. Why? 'Tis the opening performance of "The Taper of Paper", starring Jay Powell, Johnny Williams, and the best the Federal Open Market Committee has to offer. Talk about nonplussed! Surely to be Popcorn Theatre's finest hour. So grab some Gold and enjoy!

www.deMeadville.com
www.TheGoldUpdate.com
*********

Mark Mead Baillie has had an extensive business career beginning in banking and financial services for two years with Banque Nationale de Paris to corporate research for three years at Barclays Bank and then for six years as an analyst and corporate lender with Société Générale.
For the last 22 years he has expanded his financial expertise by creating his own financial services company, de Meadville International, which comprehensively follows his BEGOS complex of markets (Bond/Euro/Gold/Oil/S&P) and the trading of the futures therein. He is recognized within the financial community of demonstrating creative technical skills that surpass industry standards toward making highly informed market assessments and his work is featured in Merrill Lynch Wealth Management client presentations. He has adapted such skills into becoming the popular author each week of the prolific “The Gold Update” and is known in the financial website community as “mmb” and “deMeadville”.
Mr. Baillie holds a BS in Business from the University of Southern California and an MBA in Finance from Golden Gate University.
More from Gold-Eagle


