Gold Is Overbought And Demand Is A Concern
“Demand right now is next to nothing," -Michael Kramer, U.S. coin dealer being quoted by Reuters News, Aug 20, 2013. Over the past few days, I’ve been a fairly heavy seller of gold bullion and gold stock trading positions.
The market has showed impressive strength over the past couple of months. Strength must be sold, albeit in moderation.
Most gold analysts seem to think physical demand for gold is surging, particularly in Asia. I think demand is “tanking”, at least in the short term, and obviously some US coin dealers agree.
The US mint reports horrific August gold coin sales, and the Canadian mint is also reporting a drop in demand. If you look at the Asian demand numbers in detail, you’ll notice that most of the big demand came in the first 6 weeks of the second quarter (April 1 – May 16).
In the last 6 weeks of the quarter, demand was weak. Granted, it was weak because of heavy-handed action by Indian central bankers and the government, but it was still weak. For price to rise, demand must overwhelm supply, regardless of the reason for that demand.
The Indian government is operating a massive campaign to stifle demand for gold, and I believe it is working. Third quarter demand numbers for India could be disastrous, and that would be bearish for gold prices.
Since bottoming in June, many individual gold stocks have surged 50% - 100%. This rate of ascent is difficult to maintain, especially with gold demand waning.
Professional investors who bought into the “carnage zone” are booking some profits now.
One factor that could emerge as supportive for gold, ironically, is the upcoming FOMC minutes release. That’s scheduled for about 2pm on Wednesday, August 21, 2013.
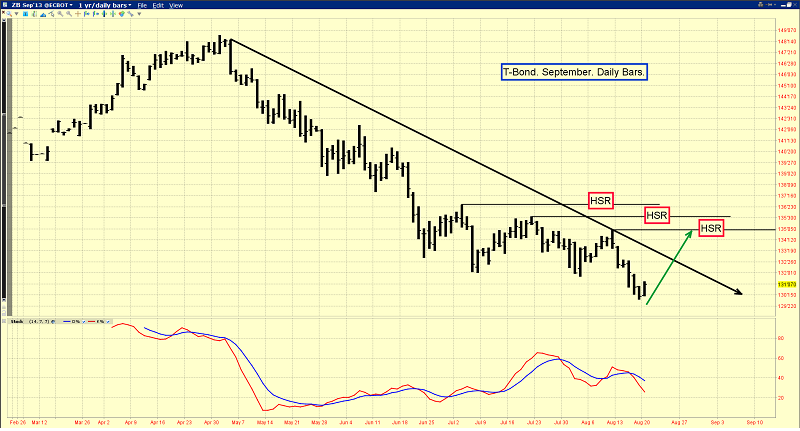
You are looking at the daily chart for the U.S. T-bond market. Since early May, there has been a substantial decline in price, and a corresponding rise in interest rates. It can be argued that the fundamental reason for the price decline of both bonds and gold was institutional anticipation of QE tapering.
Many money managers have been selling bonds and buying stocks, because they believe that if the Fed stops buying T-bonds, bond prices could enter a sustained period of decline. If the Fed were to surprise the market by tapering only a little, or not at all, that could trigger a powerful bond market rally.
Institutions could view a lack of tapering as excessive stimulation of the economy. That is inflationary, and it could cause money managers to rush into gold. The FOMC minutes release could offer an important hint of how the Fed will act, All eyes and ears in the gold community should focus on that Wednesday minutes release.
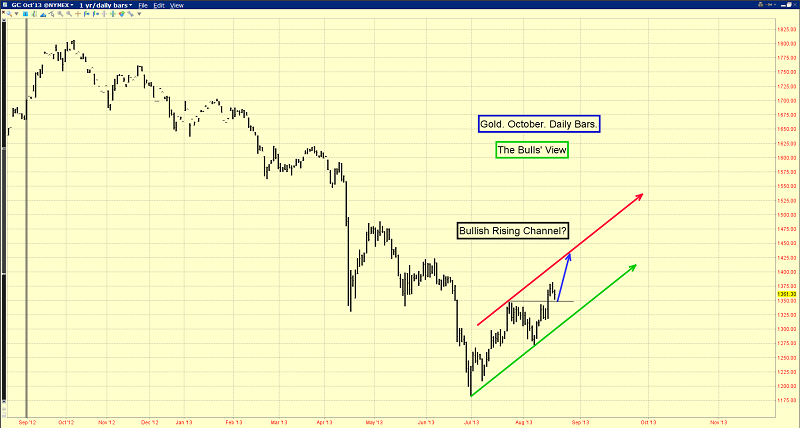
The above chart is the current daily gold chart from the perspective of a bull. Many technically-oriented bulls believe that gold is rising in a nice parallel channel, and a two day pullback to the $1350 “breakout zone” is in play now.
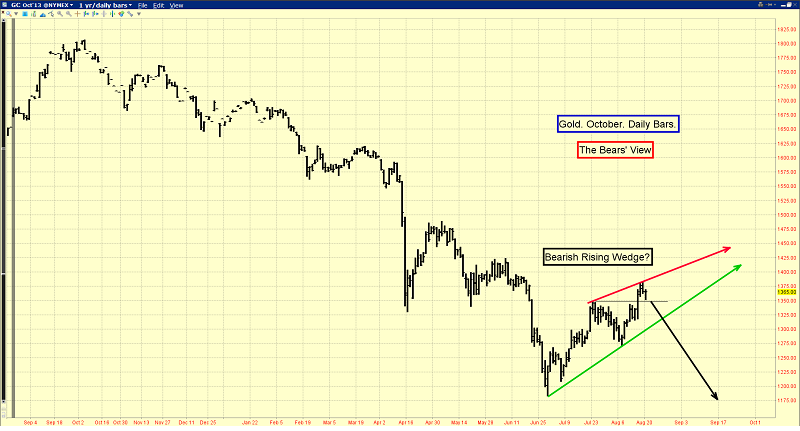
The bears view the daily chart from a different perspective. They see a potential rising wedge pattern forming, and that’s very bearish. Luckily, I need to see gold trade under $1363 for three days in a row, before I would agree with the bears.
If gold goes higher, professional investors will be selling more of their holdings, and amateurs will buy. Cheer for the bulls to win this fight, and book more profits if they do!
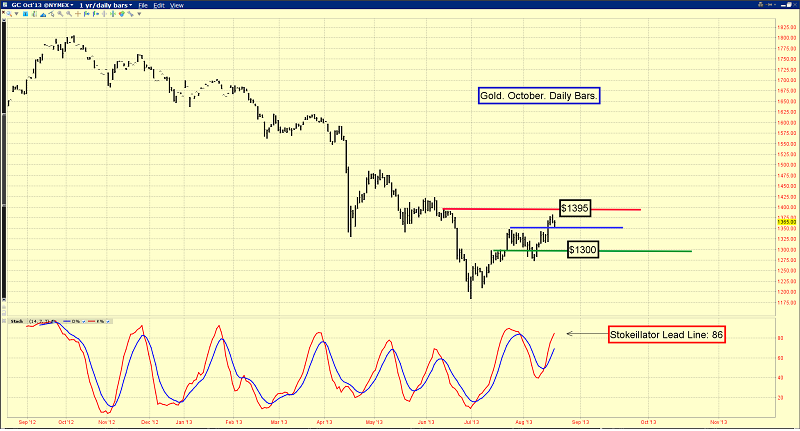
I’d like to see gold investors buying at $1300, and selling at $1395 and higher. That’s my strategy, via “PGEN” (my pyramid generator that allocates pre-set risk capital systematically).
This is another important daily gold chart. I’ve highlighted three HSR (horizontal support and resistance zones), using red, blue, and green coloured lines. While the blue line area of $1350 offers support to the bulls, that doesn’t mean that investors should buy there.
If the bears turn out to be correct, and gold tumbles lower soon, $1350 will be near the top of the sell-off. By placing buy orders deeper down on the “price grid” (near $1300), investors are likely to see some kind of rally that moves gold above there, enabling them to book profits.
Simply put, let the first HSR fish go. Buying two-day pullbacks after nearly $200 of price strength is an extremely high-risk investment tactic. Cheer for much higher prices, while only buying much lower ones.
My stokeillator (14,7,7 Stochastics oscillator) lead line is at a nose-bleed high level, near 86. That calls for caution, not wild predictions of $50,000 gold.
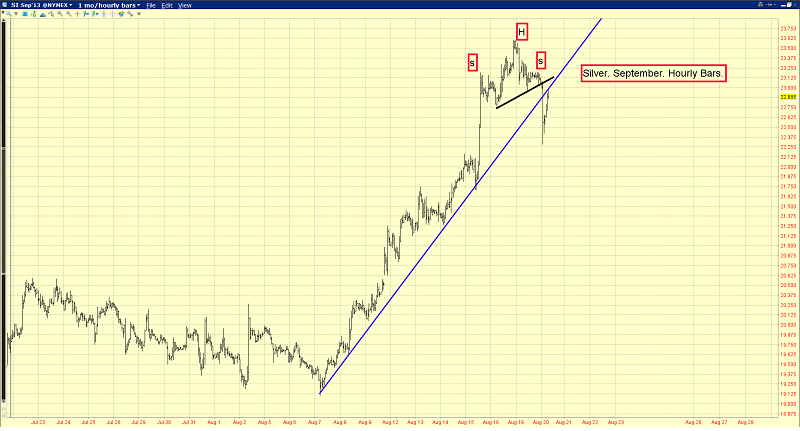
That’s a short term look at silver, using the hourly bars chart. Silver built a small head & shoulders top pattern, snapped the uptrend line, and has pulled back to it.
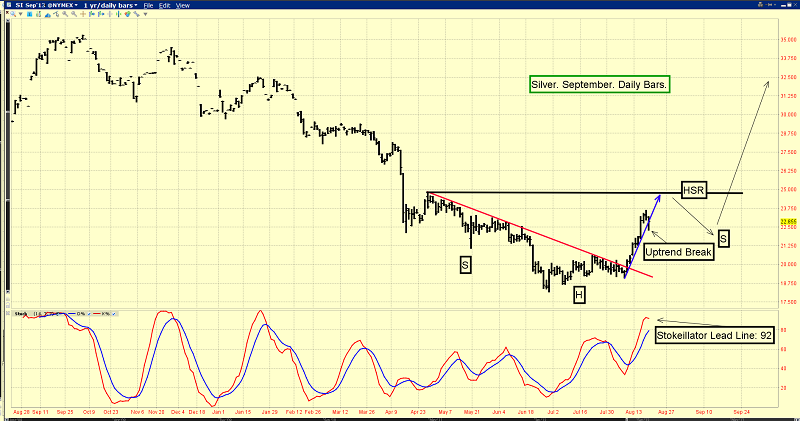
That’s the daily silver chart. Silver might be forming a fairly large inverse head and shoulders bottom pattern, but in the shorter term, it’s probably almost time for silver to rest. My stokeillator lead line is at 92, which is incredibly high. Silver has outperformed gold over the past month or so, and perhaps it’s time for silver investors to move a little capital back into gold.
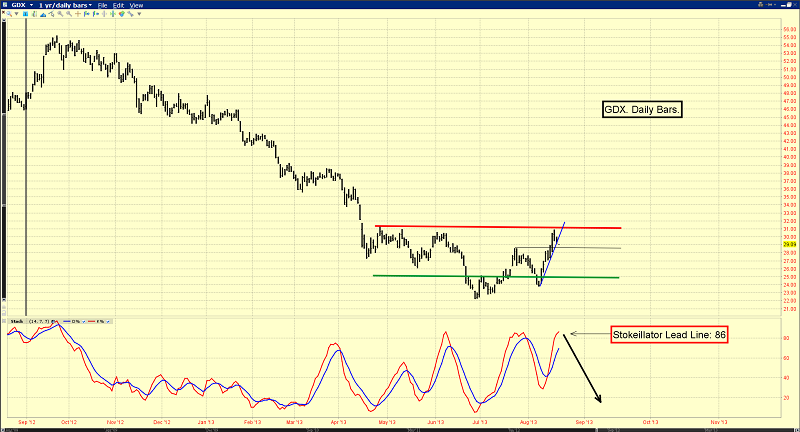
That’s the daily chart for GDX, and the situation is similar to gold and silver bullion. Gold stocks need to rest. Traders should sell the $30-32 area. I’m a buyer only at $25 or lower, although I’m cheering for buy-side HSR in the $28.35 area to “hold the line”, for the bulls!
********
Special Offer For Gold-Eagle readers: Send me an Email to [email protected] and I’ll send you my free “Explorers With Volume!” report. Even if there is a correction in the general precious metals market, many individual stocks could power higher anyways! I’ll show you the ones I’m looking at right now.
Email: [email protected]
Mail to:
Stewart Thomson / 1276 Lakeview Drive / Oakville, Ontario L6H 2M8 Canada
Risks, Disclaimers, Legal
Stewart Thomson is no longer an investment advisor. The information provided by Stewart and Graceland Updates is for general information purposes only. Before taking any action on any investment, it is imperative that you consult with multiple properly licensed, experienced and qualifed investment advisors and get numerous opinions before taking any action. Your minimum risk on any investment in the world is: 100% loss of all your money. You may be taking or preparing to take leveraged positions in investments and not know it, exposing yourself to unlimited risks. This is highly concerning if you are an investor in any derivatives products. There is an approx $700 trillion OTC Derivatives Iceberg with a tiny portion written off officially. The bottom line:
Are You Prepared?


 Stewart Thomson is president of Graceland Investment Management (Cayman) Ltd. Stewart was a very good English literature student, which helped him develop a unique way of communicating his investment ideas. He developed the “PGEN”, which is a unique capital allocation program. It is designed to allow investors of any size to mimic the action of the banks. Stewart owns GU Trader, which is a unique gold futures/ETF trading service, which closes out all trades by 5pm each day. High net worth individuals around the world follow Stewart on a daily basis. Website:


