Gold - A Perfect Storm For 2019


This article is an overview of the principal factors likely to drive the gold price in 2019. It looks at the global factors that have developed in 2018 for both gold and the dollar, how geopolitics are likely to evolve, the economic outlook and how it is worsened for the dollar by President Trump’s tariff war against China, the availability and likely demand for bullion, and the technical position in paper markets. Taken together, the outlook is bullish for gold.
2018 reprise
For gold bulls, 2018 was disappointing. From 11 December 2017, when gold made a significant bottom against the dollar at $1243, it has ended virtually unchanged today, after being 4.2% up. Gold had to struggle against a rising dollar, whose trade-weighted index rose a net 3.7% over the same period, and as much as 9.4% from its mid-February low.
Dollar strength has been driven less by trade imbalances and more by interest rate differentials. A speculating bank for its own book or for a hedge fund client can borrow 3-month Euro Libor at minus 0.354% and invest it in 3-month US Treasury bills at 2.36%, for a round trip of over 2.7%. Gear this up ten times or more, either on a bank’s capital, or through reverse repos for annualised returns of over 27%. To this can be added the currency gain, which at times has added enough to overall returns for an unhedged geared position to double the investment.
Not that these forex returns have been guaranteed, but you get the picture. The ECB and the Bank of Japan have been frozen into inactivity, reluctant to raise rates to correct this imbalance, and the punters have known it.
Financial commentators have routinely misunderstood the fundamental reason for the dollar’s strength, attributing it to foreigners’ desperate need for dollars. In fact, non-US holders of dollars hold it in record amounts, with over $4 trillion in deposits in correspondent bank accounts alone, and a further $930 billion in short-term debt. This $5 trillion of total liquidity was the last reported position, as at end-June 2017. Speculative dollar demand since then, driven by interest rate differentials, will have added significantly to these figures. The continuing US trade deficit, currently running at close to a trillion dollars annually, is both an associated and additional source of dollar accumulation in foreign hands.
Meanwhile, the same US Government data source reveals that US residents’ holdings of foreign securities was $6.75 trillion less than the foreign ownership of US securities, and the US Treasury reports that major US market participants (i.e. the US banks and financial entities operating in the spot, forwards and futures contracts) sold a net €2.447 trillion in the first nine months of 2018. Assuming these sales were not absorbed by official intervention on the foreign exchanges or by contracting bank credit, they can only have added to foreign-owned dollar liquidity.
To summarise the point; far from there being a dollar shortage, as market participants believe, the world is awash with dollars to an extraordinary degree.
The great dollar unwind is now overhanging markets, which will remove the principal depressant on the gold price. And when it begins, as a source of supply these hot-money dollars will be seen as the continuation of escalating supply, with the prospect of future US trade and budget deficits to be discounted. These dynamics are a duplication of those that led to the failure of the London gold pool in the late-sixties, which led to the abandonment of the Bretton Woods gold-dollar relationship in 1971. And as I argue later in this article, the supply of physical liquidity in bullion markets to satisfy demand arising from dollar liquidation is extremely tight.
Geopolitics and gold in 2018
It is likely that at a future date we will look back on 2018 as a pivotal year for both geopolitics and gold. Russia has moved to a position whereby it has substantially replaced its dollar reserves with physical gold. It is now able, if it should care to, to do away with the dollar entirely for its energy exports payments. It is even possible for it to link the rouble to gold.
China took the seemingly innocuous step of launching an oil contract denominated in yuan. It had prevaricated since at least 2014 before making this move, presumably conscious that it was an in-your-face threat to the monopoly of the dollar in pricing energy.
There was expectation that the oil-yuan futures contract would be a segway into a yuan-gold futures contract either in Hong Kong or Dubai, allowing countries such as Iran to avoid receiving dollars entirely. And indeed, a number of gold exchanges and interests in Asia have banded together to open a 1500-tonne vault in Qianhai to facilitate gold storage resulting from pan-Asian trade flows.
These include the China Gold and Silver Exchange Society, the Hong Kong Gold Exchange, and gold market interests in Singapore, Myanmar and Dubai. The objective is to give Hong Kong the opportunity to coordinate Asian gold markets and develop a “gold corridor” for the countries along China’s Belt and Road initiative. Therefore, both private and public sectors will be able to accumulate the oldest form of money as a backstop to local currencies, as an alternative to accumulating those of their trading partners.
Geopolitics evolved from fighting proxy wars in the Middle East and Ukraine, which were effectively won by Russia, to the less obvious war of trade tariffs. President Trump has styled himself as “A Tariff Man”. We have presumed that he is ignorant of economics, but that is no longer the point. Tariffs have evolved from a policy to make America great again to bankrupting China. China is seen as the greatest economic threat to America, and in this duel, tariffs are Trump’s weapon of choice.
The objective is to impede China’s technological development. It was tolerated when China, to steal a line from Masefield’s Cargoes, was the world’s supplier “…of firewood, iron-ware and cheap tin trays”. But China is moving on, creating a sophisticated economy with a technological capability that is arguably overtaking that of America. The battle for technological supremacy came out into the open with the detention on 1 December in Vancouver of Meng Wanzhou, the CFO of Huawei. Huawei is China’s leading developer of 5G mobile technology, installing sophisticated equipment around the world. 5G’s capability will make internet broadband redundant and will become widely available from next year.
Ms Meng’s arrest represents such an escalation of deteriorating relations between China and America that many assume it was ordered by rogue elements in America’s deep state. Maybe. But these things are difficult to reverse: does America tell the Canadian authorities to just let her go? It would uncharacteristic for America to admit a mistake, and it would probably need President Trump to personally intervene. This is difficult for him because application of the law is not in his hands.
If Ms Meng is not released, we will enter 2019 with the Chinese publicly insulted. They will realise, if they haven’t already, that ultimately there can be no accommodation with America. Fighting tariffs with more tariffs is a policy that will achieve nothing and damage China’s own economy.
It therefore becomes a matter of time when, and not if, China deploys financial weapons of its own. These will be targeted at the US’s obvious weaknesses, including her dependency on China for maintaining and increasing holdings in US Government debt. The increasingly compelling use of physical gold to both protect the yuan from attack in the foreign exchanges and limit the rise of yuan interest rates would serve to insulate China from the fall-out of a collapsing dollar.
The economic outlook, and the effect on the dollar
For market historians, the economic situation rhymes strongly with 1929, when the Smoot-Hawley Tariff Act was being debated. Eighty-nine years ago, the first round of votes in Congress was passed on 30 October, and Wall Street fell heavily that month in anticipation of the result. Following the G20 meeting two weeks ago, where it was vainly hoped there would be progress in the tariff negotiations between the US and China, markets fell heavily, reminding market historians of the 1929 precedent.
When President Hoover stated his intention to sign Smoot-Hawley into law on 16 June 1930, Wall Street crashed again. The lesson for today is that equity markets are likely to crash again if Trump continues with his tariff policies. Smoot-Hawley raised import tariffs on over 20,000 imported raw materials and goods, increasing the average tariff rate from 38% to over 60%. The difference today is that instead of tariffs being used only for protectionism, they are being targeted specifically against China.
There will be two likely consequences. The first is the the undermining of financial markets, which in the 1930s led to the virtual collapse of the US banking system and the global depression. And secondly, there is the escalation of a wider financial war raging between China and the US. These two factors are potentially very serious, with stock markets already on shaky ground.
This is not the uppermost reason for market weakness in investors’ minds, who worry about the economic outlook more generally. The conventional credit cycle features rising interest rates as a consequence of earlier monetary expansion, and the exposure of malinvestments. Markets discount the phases of the credit cycle when they become apparent to far-sighted investors, and only indirectly contribute to the collapse itself. But when valuations have become wildly optimistic, the fall in markets becomes a crisis on its own, contributing to the collapse in business that follows. This was the point taken up by Irving Fisher in the wake of the 1929-32 bear market.
In any event, the global economy appears to be at or close to the end of its expansionary phase, and is heading for recession, or worse. As well as the potential impact from an unanchored reserve currency, price inflation in the US will be boosted by Trump’s tariffs, which amount to additional consumer taxes. Price inflation pressures will then call for further rises in interest rates, while economic prospects will point to easing monetary conditions.
We have yet to see how this will be resolved. A further problem is that an economic downturn will increase government welfare commitments and therefore borrowing requirements. Bond yields will tend to rise and therefore borrowing costs, driving spendthrift governments into a debt-trap, just when price inflation is likely to demand higher interest rates. The most likely outcome will be further losses of fiat currencies’ purchasing power.
The 1930s depression saw a rising purchasing power for the dollar, with all commodity and consumer prices declining. The dollar was on a gold standard, and prices were effectively measured in gold, the dollar acting as a gold substitute. This is no longer true, and the purchasing power of the dollar, along with all other fiat currencies will at best remain stable measured against consumer products, or more likely will decline. In other words, a severe recession which looks increasingly likely on cyclical grounds, will lead to higher gold prices, irrespective of fiat currency interest rates.
The gold-fiat relationship and monetary inflation.
According to the World Gold Council, central bank gold reserves total 33,757 tonnes, worth $1.357 trillion at current prices. Global fiat money is estimated to total about $90 trillion, which suggests there’s 66 times as much in global cash and bank deposits as there is gold to back it Admittedly, issuers have different gold-to-currency ratios, but overall this suggests the gold price would be far higher if a sustainable level of currency convertibility is to return.
The reason we must consider this relationship is that in the light of all the foregoing, the gulf between the two quantities is set to accelerate from the currency side.
In the early 1930s, dollar prices of raw materials and commodities fell heavily, bankrupting farmers and miners world-wide. The purchasing power of the dollar rose, because it acted as a gold substitute. Today there is no convertibility between the dollar and gold at all, so the effect of a global economic depression is bound to see the gulf between the dollar and gold widen, as central banks expand the quantity of money in an attempt to fight recession and keep their governments solvent. There can be no doubt the policy response from the Fed and all the other welfare-state central banks will be neo-Keynesian, exploiting all the freedoms of unsound money.
In fact, the increase in the money quantity is not new, dating from the Lehman crisis. This is shown in the chart below, of the fiat money quantity, compared with its long-term pre-Lehman growth path.
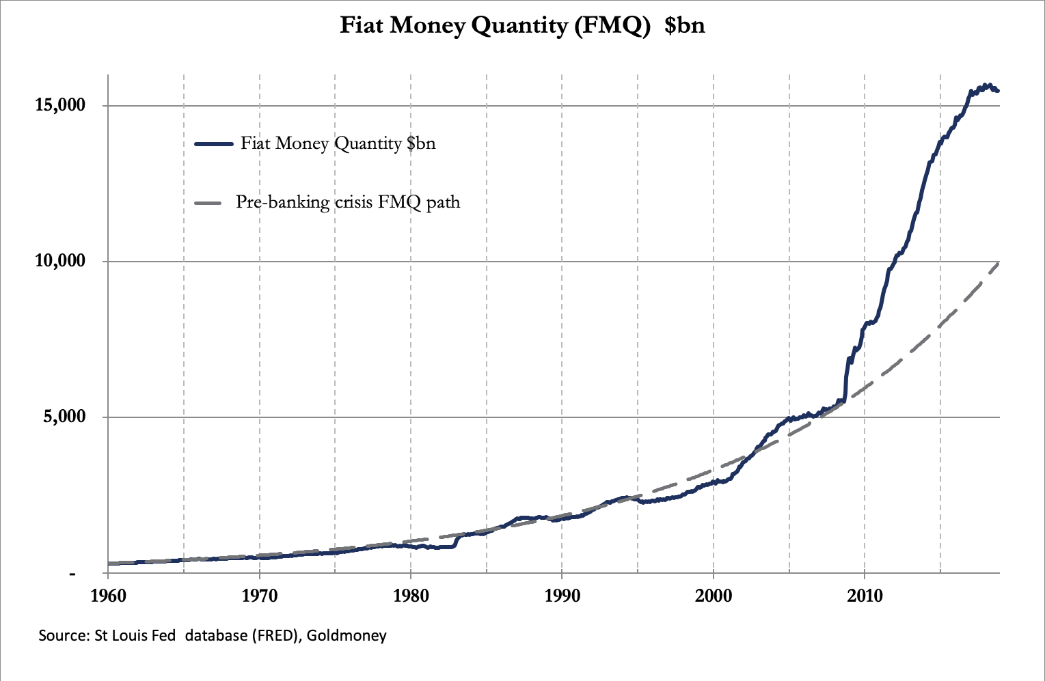
FMQ is basically the sum of true (Austrian) money supply and commercial bank reserves held at the Fed. Even though its growth has recently stalled, the gap between the pre-Lehman crisis growth path still stands at $5.55 trillion.
Now imagine what will happen when the global economy stalls. The Fed, along with other central banks, will be forced to make yet more currency available to support the banks, finance government spending and encourage consumption. The injection in the US last time was roughly $10 trillion, or 55% of GDP. Next time, with interest rates needing to be maintained in order to support the currency, it will almost certainly require more aggressive quantitative easing, with central banks substantially increasing their purchases of government bonds.
Gold is already close to all-time lows, relative to the money quantity. This is shown in the next chart.
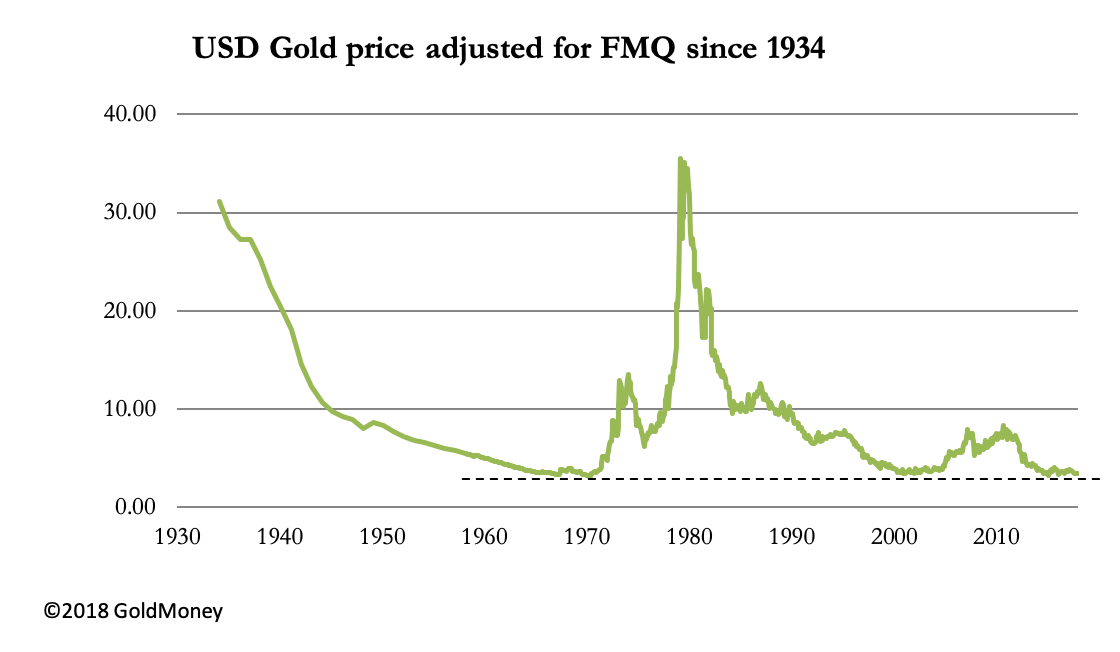
It was from similar indexed levels that gold bottomed in the late sixties. A return to the level set by President Roosevelt in January 1934 implies a price of $53,250 today. This is not a forecast, and its only relevance is to illustrate the potential for an upward adjustment in the gold price, based on the degradation of the dollar since 1934.
Physical factors
Demand for physical gold consistently exceeds mine supply. Central banks are accumulating bullion, adding 425 tonnes in the year to September 2018. Chinese private sector demand continues at a steady pace, which measured by withdrawals from the Shanghai Gold Exchange, is running at a 1,900-tonne annualised rate. India’s total gold imports were 919 tonnes in the year to end-September (according to the World Gold Council), so adding identified central bank demand to private sector demand from India and China, these three sources account for 3,344 tonnes annually, which is the same as global mine supply.
The supply/demand balance is more complicated than these figures suggest. Some of the mine supply is not available to markets. For example, China, which is the largest mine supplier by far, severely restricts gold exports. Official reserves at central banks are only what are declared and includes gold out on lease or swapped, and therefore not in possession of the central bank. They are therefore short of actual possession, exposing them to potential counterparty and price risk.
Net demand from the rest of the world and from unrecorded categories is satisfied from the existing above-ground stock of bullion, which we estimate to be about 175,000 tonnes. Only an unknowable fraction of this is available for market liquidity. The most identifiable swing-factor is ETF demand, which saw outflows of 103 tonnes in the three months to September. Looking back over recent years, another substantial ETF outflow was in 2016 Q4, when the gold price bottomed, and in 2015 Q2 to Q4 saw net outflows every quarter. It appears that ETF demand is acting as a contrary indicator of future price trends.
This fits in with market theory, which based on investor psychology predicts investors are at best trend-chasers, investing most heavily at market tops and liquidating positions at price lows. The peak of net ETF liquidation in 2018 was in June and August. In June the gold price breeched the psychologically important $1300 level, and in August the market turned higher at $1160. ETF net selling tells us therefore the gold price may have recently indicated a turning point.
Supply from ETFs at market lows satisfies demand from those that have a continuing demand. We have seen the pattern of central banks increasing their buying on lower prices, but there is also some evidence commercial banks are accumulating bullion for their own books, possibly for risk purposes.
Under the new Basel III standard, physical gold held on an allocated basis is now classified as cash and has the advantage of zero risk weighting, compared with a 15% haircut under Basel II. Besides physical cash notes (which in practice banks try to minimise in their branches), the only other alternative to cash is balances held on the bank’s account at a central bank. The ECB and the Bank of Japan charge negative interest rates on these balances, which for commercial banks in the EU and Japan leaves only physical gold as an alternative.
For the thinking banker, it makes sense to hedge fiat currency exposure (which is the entirety of his business) with some physical bullion. The opportunity cost in the form of lost interest is not a factor, with overnight money-market rates in euros and yen negative. And the regulatory cost of holding gold is being removed.
A brief analysis of the availability of physical supply points to acute shortages on any expansion of demand. Seasonal factors can have a significant impact, with the Diwali festival in India a month ago, and the Chinese New Year in early February leading to an accumulation of bullion inventories.
The absorption of available liquidity from mine supply and scrap recycling tells us the physical market has become extremely tight. Instability in fiat currencies, particularly weakness developing in the dollar’s trade-weighted index, could therefore have a disproportionate effect on the gold price as a wide range of investing institutions and commercial banks try to correct their almost zero asset allocation to gold.
Paper markets for gold
As the chart below shows, gold bottomed in December 2015, since when it has been in a narrowing consolidation. Within this pattern, there is a seasonal effect, whereby gold sells off in early December and subsequently rallies. This is shown by the three black arrows on the chart.
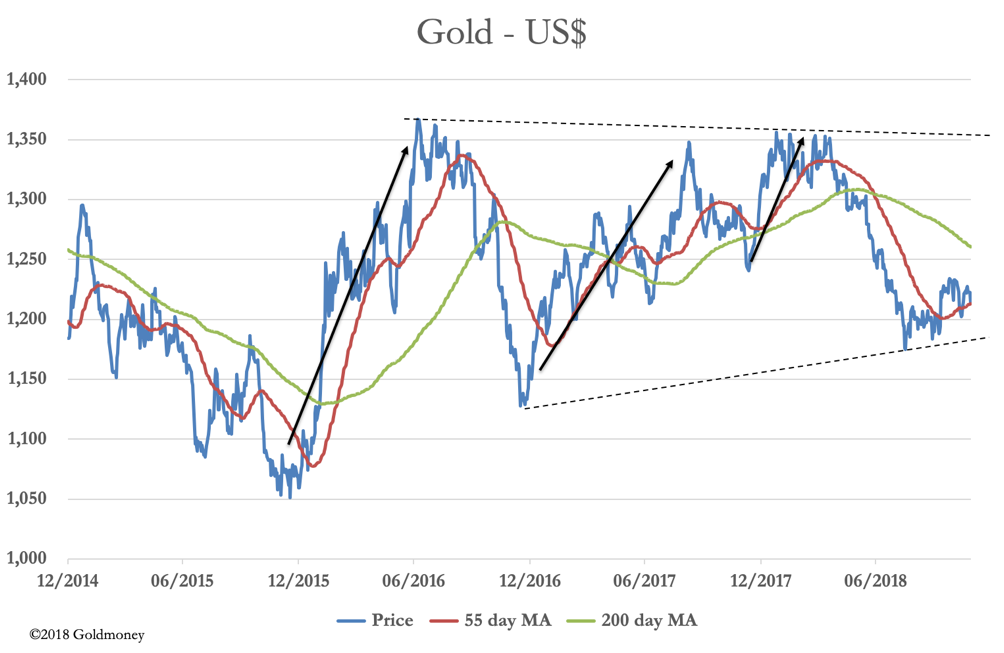
There are reasons why this is so. The December contract is the last active contract to expire before the year end, when many hedge funds and bullion banks make up their accounts. Hedge fund managers want to present a balance sheet with less risk exposure than they normally run, and banks will wish to present shareholders and regulators with a sanitised version of their risk exposure as well.
This exposure cycle has had an extra twist this time, because market speculators in futures markets have shorted a wide range of futures in order to capture a strong dollar. In the case of the Comex gold future, this has led to an unprecedented technical position, shown in the next chart.
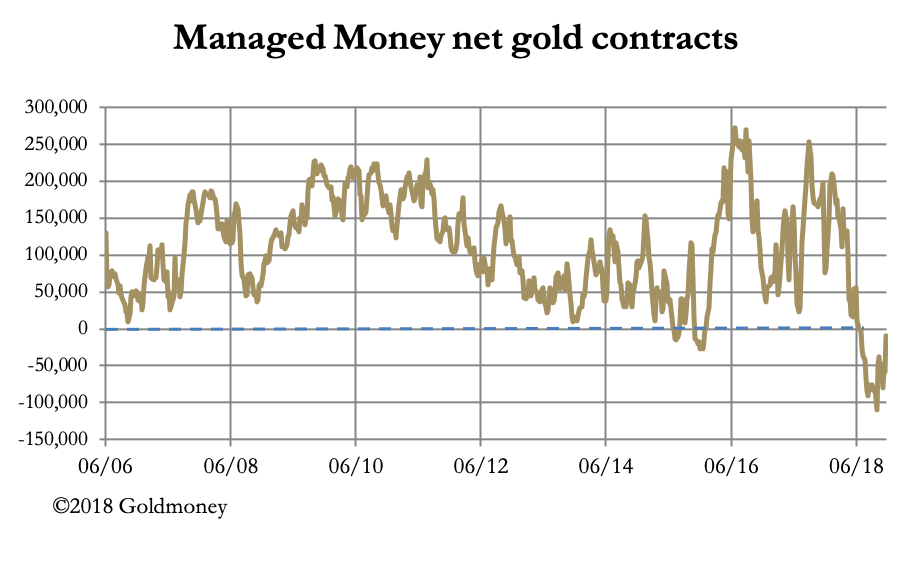
Over the last twelve years, hedge funds (which are represented in this category of speculator) have only been net short of Comex gold contracts twice. The first time was in late-2015, which marked the end of the 2011-15 bear market, and the second was recently, marking the sell-off to $1160. The only reason it has partially corrected is due to the expiry of the December contract.
Market sentiment is still markedly pro-dollar and anti-everything else, including gold. The underlying assumption appears to be that foreigners require dollars and the dollar has the highest interest rates of the major currencies. This being the case, the first supposition is an error. There is a growing expectation that the US economic growth will slow next year, and the Fed is under pressure not to raise rates any further.
When these changing factors are taken into account, the dollar is likely to be sold, and hedge fund speculators will take the other tack. The market-makers, traditionally the bullion banks, are bound to be aware of this possibility and will therefore try to maintain an even book.
Conclusion
All factors examined in this article point to higher gold prices in 2019. They can be summarised as follows:
-
The world is awash with dollars at a time when markets act as if there is a shortage. When the truth emerges, the dollar has the potential to fall substantially against other currencies, leading to a rise in the price of gold.
-
The move towards gold and against the dollar in Asia accelerated in 2018, with Russia having replaced the dollar with gold as its principal reserve currency. China has laid the foundation with an oil-yuan futures contract, which can be a bridge to yuan-gold contracts in both Hong Kong and Dubai. This is a direct challenge to the dollar as a reserve currency, and likely to be attractive to oil suppliers, such as Iran, seeking to circumvent use of the dollar and accumulate gold instead.
-
America’s trade war against China appears to be less about unfair trade practices and more about stopping China from evolving into a serious technological competitor against the US. In 2019, there is a strong possibility the tariff war will escalate into a wider conflict, with China selling down its exposure to the dollar and US Treasury debt. That would create significant difficulties for the US Government and the dollar itself.
-
With the credit cycle turning and the addition of American tariffs, markets are at a growing risk of replicating the 1929-32 crash and the economic depression that followed. This time, instead of commodities and consumer products effectively priced in gold through a gold standard, they will be priced in fiat currency. Monetary policies will ensure liquidity is freely available to support the commercial banks, government spending and economic activity. This is a recipe for higher gold prices.
-
Demand for physical gold continues to outstrip mine supply. In 2019, risk-weighting rules in Basel III open up the opportunity for commercial banks to augment their liquidity with allocated bullion, attractive to euro- and yen-based banks who face negative interest rates on short-term cash alternatives.
-
The technical position in the paper markets looks favourable, with close to record levels of bearishness, and an established pattern of December rallies in the gold price.
Alasdair Macleod
HEAD OF RESEARCH• GOLDMONEY
Twitter: @MacleodFinance
MOBILE: +44 7790 419403
Goldmoney
The Most Trusted Name in Precious Metals tm
NEW YORK | ST. HELIER | TORONTO
Publicly Traded Symbols: CA: XAU | US: XAUMF
© 2017 GOLDMONEY INC. ALL RIGHTS RESERVED. THIS MESSAGE MAY CONTAIN CONFIDENTIAL OR PRIVILEGED INFORMATION. IF YOU ARE NOT THE INTENDED RECIPIENT, PLEASE ADVISE US IMMEDIATELY. THIS MESSAGE IS FOR GENERAL INFORMATION ONLY AND SHOULD NOT BE CONSTRUED AS AN OFFER OR SOLICITATION OF AN OFFER TO BUY SECURITIES OR ANY OTHER FINANCIAL INSTRUMENTS. WE DO NOT PROVIDE TAX, ACCOUNTING, OR LEGAL ADVICE, AND RECOMMEND THAT YOU SEEK INDEPENDENT PROFESSIONAL ADVICE IF NECESSARY. WE CONSIDER INFORMATION IN THIS MESSAGE RELIABLE BUT WE DO NOT REPRESENT THAT IT IS ACCURATE, COMPLETE, AND/OR UP TO DATE AND IT SHOULD NOT BE RELIED ON AS SUCH. OPINIONS EXPRESSED ARE OUR CURRENT OPINIONS AS OF THE DATE APPEARING ON THIS MESSAGE ONLY AND ONLY REPRESENT THE VIEWS OF THE AUTHOR AND NOT THOSE OF GOLDMONEY INC OR ITS SUBSIDIARIES UNLESS OTHERWISE EXPRESSLY NOTED.
Notice: This email may contain confidential or privileged information. If you received this email in error or believe you are not the intended recipient, please notify the sender immediately and delete this email without forwarding or opening any attachments. Thank you for your cooperation and attention.
More from Gold-Eagle


