Gold Post-Blue Ripple Trends To Technical Trickle


Pre-Stateside elections a week ago we penned (the "BUT" therein notwithstanding):
"...should Congressional power shift left, gold ought shift up and get above The Box (1240-1280). Should Congressional power stay right, gold ought shift down and fumble about in the upper 1180s. Either way, look for price to escape this recent drudgery of the 1230s..."
Which now, a week hence, it has.
Obviously as by now you well know, lawmaking power in the US shifted both left and right, resulting in various renaming of The Blue Wave to The Blue Ripple, The Blue Trickle, even The Blue Tinkle, save for the State of California which suffered The Blue Tsunami, voters here electing a so-called "super majority" forthwith enabling the legislature in Sacramento to raise our taxes at will. How 'bout dat for the world's eighth-largest economy, eh?
As for Washington DC for which 'tis said "gridlock is good", post-election on Wednesday saw all eight of our BEGOS Markets (Bond, Euro/Swiss, Gold/Silver/Copper, Oil, S&P) trade materially higher over their respective Tuesday settles; but come Thursday through week's end, most of the gains were hoovered away and then some, including those for gold.
Gold had closed pre-election results this past Tuesday essentially "still in Kansas" at 1229. But then price joined the ensuing rally party and tried to breach the base of The Box (1240-1280) ... yet couldn't work any higher than 1238 before trending down into week's end and settling yesterday (Friday) at 1210.
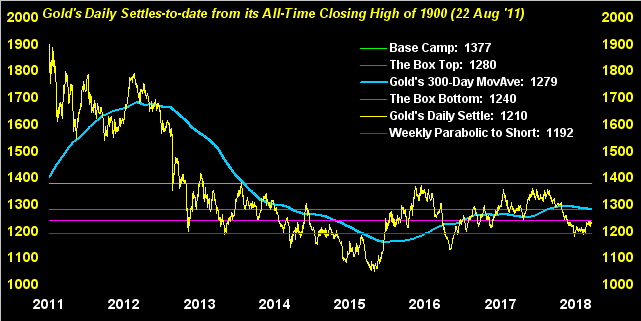
Thus in turning to gold's weekly bars and the notion that the government's hands essentially are now tied for any substantive legislative changes until early in 2021, gold has seemingly shrugged its shoulders, resigned to decline toward the ascending blue dots of parabolic Long trend. Gold's expected weekly trading range at present is 26 points: but price itself is only 18 points above the 1192 level which would flip said trend to Short. Add in that the Federal Open Market Committee has all but formally made its next FedFunds raise (effective 19 December) and that per this missive's opening gold Scoreboard price from here over the past two years has tended to trade lower, this recent gold rally seems nearly over:

That said, in turning to gold's daily closes from the All-Time High-to-date, note the red line -- which is the aforementioned 1192 price that would flip the weekly parabolic trend to Short -- is also representative of support in the rightmost area of the graphic. We technically eye that as a gold positive such that this next downtrend ought not carry price too low per our "...fumble about in the upper 1180s..." comment:
"Yer always positive, mmb..."
Squire! Been quite awhile given everyone's peregrinating about the planet. Anyway, good to see you're still with us. "Yep, was on a fisheries consulting gig over in the Maldives, and ..." We can imagine, Squire.
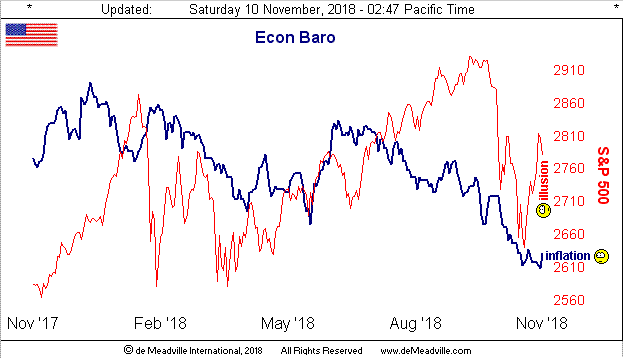
But "positive" is the word for the Economic Barometer this past week, albeit the load of incoming data was quite sparse. The most notable element was the +0.6% rise in October's Producer Price Index, a level equaled in January a year ago as well as in April 2014, but not exceeded since June 2013. Still there's this from the "Is It Stagflation? Dept.": Consumer Credit increased in September by just $11 billion, well off the 12-month average of $18 billion. The consumer -- America's biggest economic driver -- may be backing off, but inflation surely is there, as is the illusion that stocks remain the place to be. With a baker's dozen of metrics due in the new week, here from a year ago-to-date is the Econ Baro along with the S&P 500:
Moreover, with StateSide government out of the way for the next two years (save for us taxed-'til-we-terminate Californians), this may well be the stretch to bring severely misvalued assets into line, (yes, specific to our ongoing saw of the S&P being priced at double its earnings valuation and gold at but half its monetary debasement valuation) ... Let's just get this done!
And we're not the only one in having read this past week about "What the path to an ‘honest-to-God vicious selloff’ by year end could look like" and about "... the next market mess unfolding ‘earlier than expected’..." History proves time and again than inevitability always comes 'round.
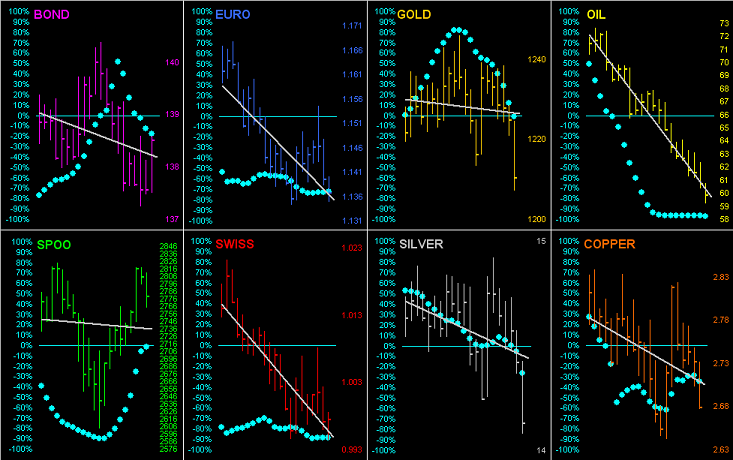
'Round indeed, for with our elections in the books (supposedly), let's go 'round the entirety of the BEGOS Markets. In each of the eight respective panels we've the trading bars for the last 21 trading days (one month) along with the baby blue dots which depict the day-to-day consistency of the diagonal trendlines, all of which are in decline. Note for gold, and certainly so for Silver, that their "Baby Blues" are only just now passing below their 0% axes: such event generally leads to still lower prices, sadly adding to our expectation that gold near-term is 1180s-bound:
Further as we next turn to the precious metals' 10-day Market Profiles for gold on the left and silver on the right, we see prices' fall from grace after having dwelled at the top their respective stacks to the bottom:
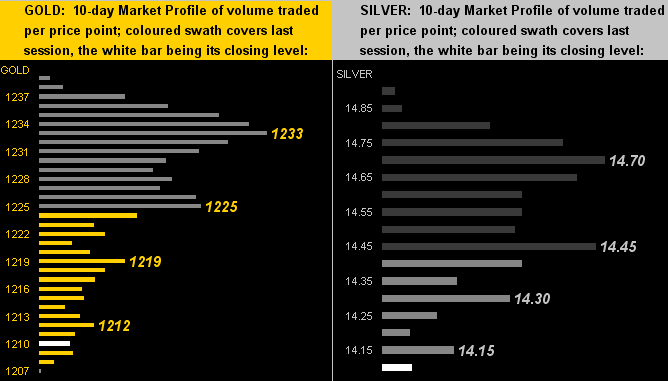
Speaking of stacks, let's look at that for gold down through its many key levels as price itself remains way down there:
The Gold Stack
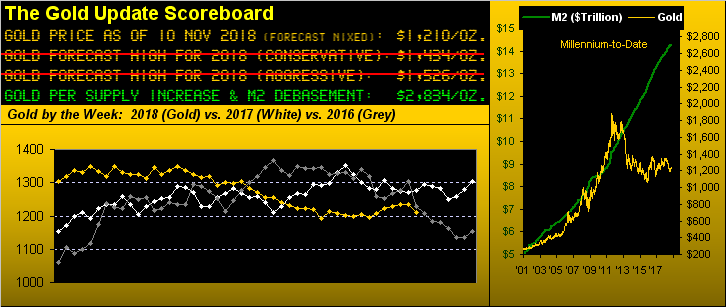
Gold's Value per Dollar Debasement, (from our opening "Scoreboard"): 2834
Gold’s All-Time High: 1923 (06 September 2011)
The Gateway to 2000: 1900+
Gold’s All-Time Closing High: 1900 (22 August 2011)
The Final Frontier: 1800-1900
The Northern Front: 1750-1800
On Maneuvers: 1579-1750
The Floor: 1466-1579
Le Sous-sol: Sub-1466
Base Camp: 1377
2018's High: 1369 (11 April)
The 1360s Double-Top: (1362 in Sep '17 and 1369 in Apr '18)
Neverland: The Whiny 1290s
The 300-Day Moving Average: 1279 and falling
The Box: 1240-1280
10-Session “volume-weighted” average price magnet: 1227
Trading Resistance: 1212 / 1219 / 1225 / 1233
Gold Currently: 1210, (expected daily trading range ["EDTR"]: 12 points)
Trading Support: none, per the profile
10-Session directional range: down to 1207 (from 1239) = -32 points or -2.6%
The Weekly Parabolic Price to flip Short: 1192
2018's Low: 1167 (16 August)
Summing it all up (or perhaps more accurately "down"), we've the elections behind us, we know what the Fed is going to do, and 'tis time to face as noted the truths about valuation. Give the reality that "the market is never wrong" ('tis what 'tis, right?) the S&P is way too high and gold is way too low. A long-time tennis club acquaintance stopped by our perch therein this past week and quietly said: "We've sold everything." Perhaps someone "in the know", although: 'tis always good to grab a little gold!

Mark Mead Baillie has had an extensive business career beginning in banking and financial services for two years with Banque Nationale de Paris to corporate research for three years at Barclays Bank and then for six years as an analyst and corporate lender with Société Générale.
For the last 22 years he has expanded his financial expertise by creating his own financial services company, de Meadville International, which comprehensively follows his BEGOS complex of markets (Bond/Euro/Gold/Oil/S&P) and the trading of the futures therein. He is recognized within the financial community of demonstrating creative technical skills that surpass industry standards toward making highly informed market assessments and his work is featured in Merrill Lynch Wealth Management client presentations. He has adapted such skills into becoming the popular author each week of the prolific “The Gold Update” and is known in the financial website community as “mmb” and “deMeadville”.
Mr. Baillie holds a BS in Business from the University of Southern California and an MBA in Finance from Golden Gate University.


