Gold Price And Silver Price Updates


As expected Gold has been breaking out of its triangle formation and quickly pushed higher. So far $1,191 has been the high of this move - still way below my target at $1,237. Unfortunately during the last seven trading days the bullish momentum has been slowly fading away. You can still call the price action a bullish consolidation but I do not want to see a daily close below $1,157 anymore. Otherwise the rally is over!
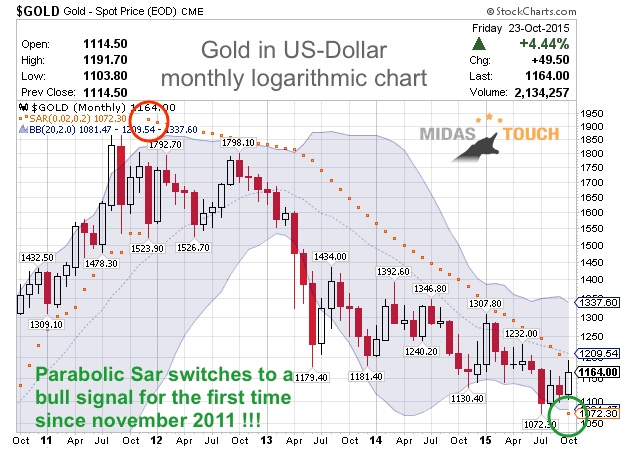
Good news on the long-term monthly gold chart, which is part of my Gold Model!
After four consecutive years with a sell signal the monthly chart switched to a bull signal on October 15th! This is a very positive development.
The super simple yet phenomenal Parabolic SAR Indicator would have kept you out of any long positions in Gold since November 2011. Now the indicator has switched -- and the Gold Price has to fall all the way back below $1,072 to change this indicator's reading.
Overall another signal that the bear-market might be over.
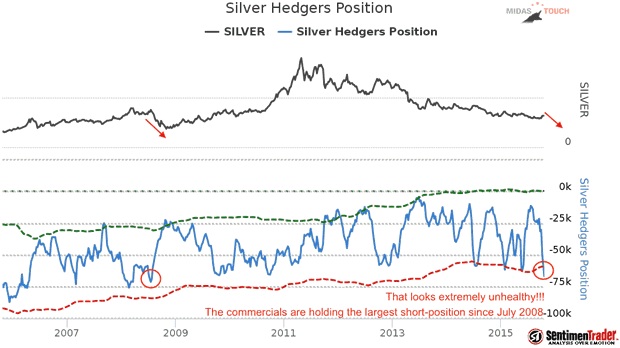
The latest commitment of trades (CoT-Report) have deteriorated rather dramatically. Especially in the silver market the commercial players (= professionals, bullion banks, smart money and mining companies who need to hedge their production) have built up a massive short position once again. Also for the gold market, the current positioning is a sell signal (see my model). The air is already getting very thin for the precious metal bulls here.
It will be interesting to see how fast the commercials will cover their shorts into the next larger correction.
Clearly a strong warning signal and therefore only very limited upside potential in Gold and especially in the Silver Price!
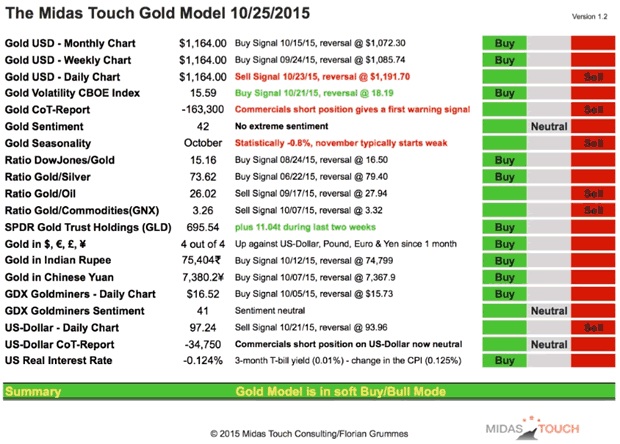
Midas Touch Gold Model Summary
Compared to last week, we have the following changes:
- A new sell signal on the Gold USD-Daily Chart -- and an important sell signal from the Gold CoT-Report. Gold Seasonality will be a sell until mid-November.
- New buy signals are coming from the Gold Volatility Index and for the SPDR Gold Trust Holdings.
- Gold Sentiment and US-Dollar CoT-Report have moved to neutral readings.
- Overall the model is in Soft Buy/Bull model but it is very close to switch to neutral.
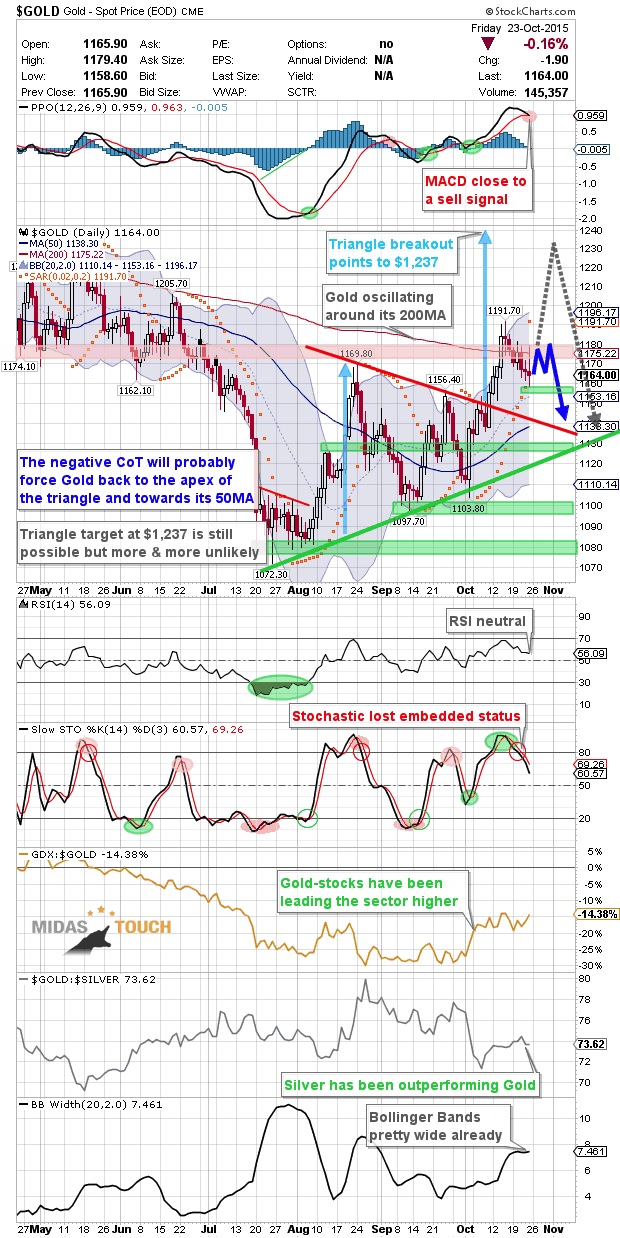
Gold Daily Chart
The fact that the bullish momentum is fading away plus the negative CoT-report increases the probability that Gold's rally is already done. There is still a chance to continue towards the triangle target at $1,237 but more likely is a correction back to the 50MA around $1,138 which coincides with the apex of the triangle. Generally as long as the 50MA is moving below the 200MA the bears remain in control over all. November should bring clarity whether we have just witnessed another bear market rally or whether Gold can find support above the September lows and start another rally into spring 2016.
Recommendations
- Swing-traders should tighten their stops on any remaining long position. A daily close below $1,157 should be the last confirmation. I would use any strength towards $1,175-1,180 to sell Gold short with a 1st target at $1,138 and a stop at $1,192. Definitely continue to hold GDX and GDXJ and trail your 25% stop-loss.
- Regarding "buy the dip" I think the new up trend line currently around $1,120 in combination with the lower Bollinger Band at $1,110 should deliver enough support for a long entry around $1,115-$1,120.
- Investors should be patient and wait for renewed weakness in November.
Long-term personal beliefs
It's still too early to call the end of the four year bear-market in Gold and Silver. But recent price action has certainly improved the picture. Once this bear is over a new bull-market should start and push Gold towards $1,500 within 2-3 years.
Gold has become somehow a fallen angel therefore it will need much more time to regain the lost confidence.
Long-term price target DowJones/Gold-Ratio remains around 1:1.
Long-term price target Gold/Silver-Ratio remains around 10:1 (for every ounce of gold there are 9 ounces of silver mined, historically the ratio was at 15:1 during the Roman Empire).
Long-term price target for Gold remains at US$5,000 to US$8,900 per ounce within the next 5-10 years.
Fundamentally, as soon as the current bear market is over Gold should start the final 3rd phase of this long-term secular bull market. 1st stage saw the miners closing their hedge books, the 2nd stage continuously presented us news about institutions and central banks buying or repatriating gold. The coming 3rd and finally parabolic stage will end in the distribution to small inexperienced new traders & investors who will be subject to blind greed and frenzied panic.
********
If you like to get regular updates on this model and gold you can subscribe to my free newsletter here: http://bit.ly/1EUdt2K
 Florian Grummes (born 1975 in Munich) has been studying and trading the Gold market since 2003. In 2008 he started publishing a bi-weekly extensive gold analysis containing technical chart analysis as well as fundamental and sentiment analysis. Parallel to his trading business he is also a very creative & successful composer, songwriter and music producer. You can reach Florian at: [email protected].


