Gold Price And The Whole Enchilada


"Oh woe is gold! The Fed shall further raise its rate! Oh woe is Gold! The Dollar is looking all so great!"
We interrupt this conventional "wisdom" with the following friendly reminder:
Neither does gold care so much about interest rates as it does the massive level of debt, nor does it play currency favourites. We need only remind ourselves of the following twelve-month stint from December 2004 through November 2005: the FedFunds rate doubled from 2% to 4%, the Dollar Index rose 12%, and gold rose 10%. "It's just impossible..." No 'tisn't, Perry Como. Look:
Yet for the present, gold's picture remains poor. For even with 10 points of COMEX December premium added into gold's now "front month" price, it still couldn't manage a gain for the past week, settling yesterday (Friday) at 1222 which we see here in the weekly bars as the red dots of parabolic Short trend further descend:
But wait, there's more, or perhaps better stated, less. 'Tis a bit of a technical scare, so skipping the next bit is clearly warranted for the weaker stomachs out there as we turn to the same drill with the parabolic trend for gold's monthly bars from April 2014-to-date. Those two rightmost red dots are not a welcome sight:
"Enough of the pain, mmb ... how does gold stand year-to-date?"
Well, Squire, as another month has passed, here are our BEGOS Markets Standings through July plus the first three trading days of August. And 'tis clear: all that's anti-Dollar is down, (playing currency favourites notwithstanding), the one exception being the stock market as measured by the S&P 500 (+6.2%), which in general prefers a weaker Dollar to enhance foreign returns. For gold (-6.4%), it could be worse: it could be Copper (-16.4%). Oh wait: we proved last week that gold IS Copper! Terrifique, eh? Here are the Standings:
As for stocks, with some 100 S&P companies still to report their Q2 earnings, the season is being slanted as "terrific" with 79% of the reports thus far having beating "estimates": but the fact remains that the actual level of earnings is far too low to support the S&P's lofty level of 2840 (now just 32 points short of the 2872 all-time high), especially as the shorter end of the yield curve rises. Bob Shiller's "cyclically-adjusted price/earnings ratio" is 32.7x and our median "live" p/e across the 500 constituents is 23.4x.
Moreover with respect to the S&P: remember all that overdue tech carnage a week back when FB planted -19% and then TWTR thudded -20%? The S&P just prior to those two butt-kickings was at 2846, from which it declined some 50 points; yet as just noted above, 'tis mostly recovered. But here's the dirty little secret: the money that came out of the S&P has hardly came in back a wit. From the website, here's our present view of the S&P's points change from a month-ago-to-date along with its moneyflow regressed into S&P points. Nuff said:
Neither faring as well as touted is the StateSide economy, at least through the eyes of the Economic Barometer. And talk about "divergence". Amongst the past week's cavalcade of incoming data came a firm increase in ADP's July payrolls measure from 181k in June to 219k ... but the Dept. of Labor Statistics metric fell from 248k to 157k. "Doink!" On the rise came readings in Consumer Confidence, Pending Home Sales, Factory Orders and the Chicago Purchasing Managers Institute's survey; but slowing or falling came results for the Q2 Employment Cost Index, the Fed's preferred inflation stat of Core Personal Consumption Expenditures, the Institute for Supply Management's surveys for both manufacturing and services, Vehicle Sales, and a deepening Trade Deficit. Add 'em and subtract 'em and the result is a falling Econ Baro whilst buys continue the S&P's rise to the skies. (And yes, S&P 2154 remains on our radar):
Meanwhile with flagging gold having passed -- indeed "passed out" -- into August, here are the year-over-year percentage tracks of the yellow metal and several of its key equities brethren, for which the broad bent basically is butt-ugly: Newmont Mining (NEM) is essentially "unch" from this time a year ago, Franco-Nevada (FNV) is -1%, both Goldcorp (GG) and gold itself are -4%, the VanEck Vectors Gold Miners exchange-traded fund (GDX) is -7%, and lagging of course at the rear is the Global X Silver Miners exchange-traded fund (SIL) -20%, hardly a surprise given the Gold/Silver ratio remains historically high at 79.2x. "Gettin' some serious negative air there, Silver dude!"
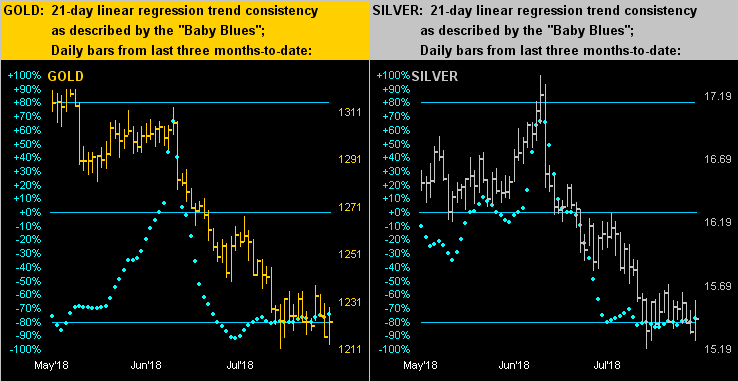
As for market trend, let's next go to the last three months of daily bars for gold on the left and silver on the right. Give your four-year old a crayon and they can intuitively draw the downtrend line on both panels. That being obvious, price for both metals has been basing these past two weeks, (albeit gold got that 10-point-freebie of infused December premium this past week). Indeed, given our forecast high for this year of 1434 having well been blown to smithereens, we were asked at last Sunday's Investors Roundtable where gold will finish the year -- to which we replied, "right 'round here", i.e. in the low 1200s, (for which our one-minus-alpha confidence level is about 3%). Share the misery:
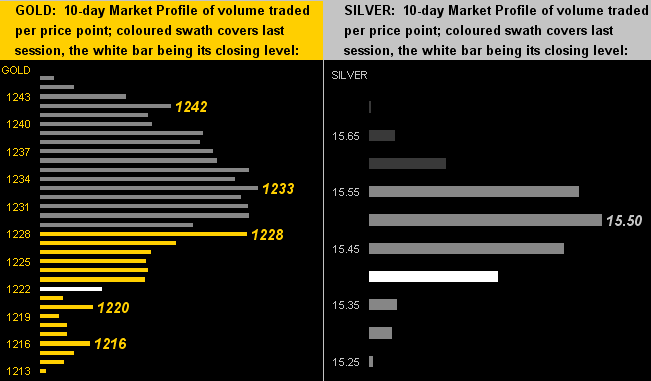
For the near-term trader, here are the 10-day Market Profiles for gold (at left and as adjusted for the roll into December's pricing), and for silver (at right). King Gold is sporting quite the thicket of overhead resistance, whilst we find Sister Silver again giving us the single-finger salute:
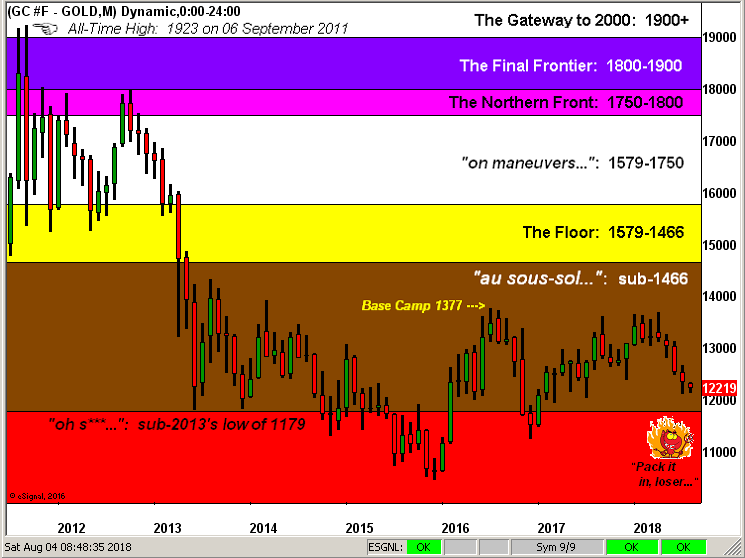
And so in closing, we've gold's structure as presented by its monthly bars from 2011's All-Time High of 1923. As bad as it looks, it doesn't look that bad. Rather 'tis the stock market that looks so good, 'tis bad. Which in turn makes gold down here look so good. The S&P vs. Gold. Fluff vs. Foundation. Symbolism vs. Substance. Witless vs. Wealth. Mania vs. Money. Make your good choice:
Dare we conclude with a puff of the chest, your five-minute read of the foregoing we trust has made you more informed that watching five days of FinTV. 'Course we hope 'tis the case every week. Now go be the smartest 'round the summer grill. The whole enchilada, and gold!

Mark Mead Baillie has had an extensive business career beginning in banking and financial services for two years with Banque Nationale de Paris to corporate research for three years at Barclays Bank and then for six years as an analyst and corporate lender with Société Générale.
For the last 22 years he has expanded his financial expertise by creating his own financial services company, de Meadville International, which comprehensively follows his BEGOS complex of markets (Bond/Euro/Gold/Oil/S&P) and the trading of the futures therein. He is recognized within the financial community of demonstrating creative technical skills that surpass industry standards toward making highly informed market assessments and his work is featured in Merrill Lynch Wealth Management client presentations. He has adapted such skills into becoming the popular author each week of the prolific “The Gold Update” and is known in the financial website community as “mmb” and “deMeadville”.
Mr. Baillie holds a BS in Business from the University of Southern California and an MBA in Finance from Golden Gate University.
More from Gold-Eagle


