Gold Price In Countertrend Correction - Higher Highs To Follow


Last week's trading saw gold continuing to make higher highs for the mid-term upward phase, with the metal running all the way up to a peak of 1300.40 - made in Friday's session. From there, a quick correction was seen, though ending the week higher overall. The current decline phase is anticipated to end up as countertrend, and - if correct - should be followed by higher highs into early-to-mid February.
Gold Short-Term
For the very short-term, a correction phase was due to materialize - with that correction coming from the 34-day time cycle. In terms of time, the most recent upward phase of this wave was well into extended range for a top, and the action seen on Friday now favors the downward phase of this wave to be back in force:
From the comments made in my prior articles, the last short-term correction came and went with the smaller 10 and 20-day cycles, with that decline also anticipated to end up as a countertrend affair - inside a larger 34, 72 and 154-day cycle upward phase. What followed was a higher high for the swing, though that higher high was expected to peak the next larger cycle, the 34-day component. Here again is that 34-day cycle:
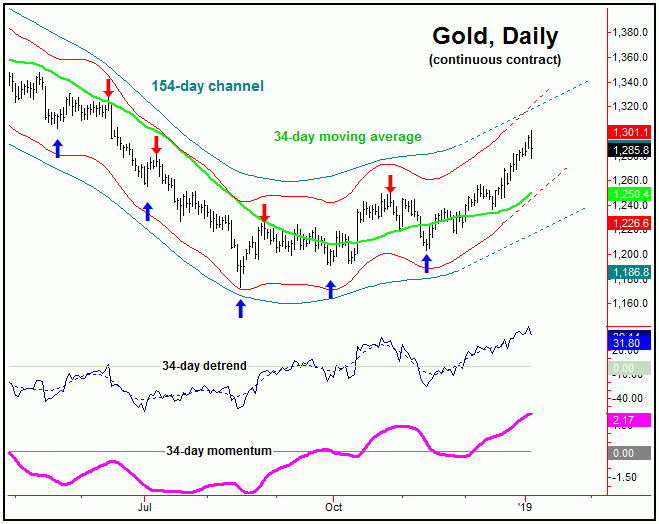
In terms of time, the next 34-day trough is actually due to materialize anywhere in the current timeframe, with its trough having been projected for the January 7-11 timeframe. Support to the downward phase of this wave is at or near the 34-day moving average, which is also at or near the lower 34-day channel line (in red), on our chart.
As noted above, the patterns do favor the current downward phase of the 34-day cycle to end up as a countertrend retracement. In terms of price, that means the metal should remain at or well above the prior swing low of 1236 (February, 2019 contract). If correct, higher highs should follow this correction into what is projected to be the early-to-mid February timeframe.
Gold's Mid-Term Picture
Stepping back, until proven otherwise, the upward phasing of the larger 72-day, 154-day and 310-day cycles is deemed to be in force, which is why the probabilities favor any decline with the smaller-degree (34-day on down) cycles to end up as countertrend. If correct, higher highs should follow into the early-to-mid February timeframe, a move which should then peak the larger 72 and 154-day cycles, for a sharp correction into mid-to-late Spring:
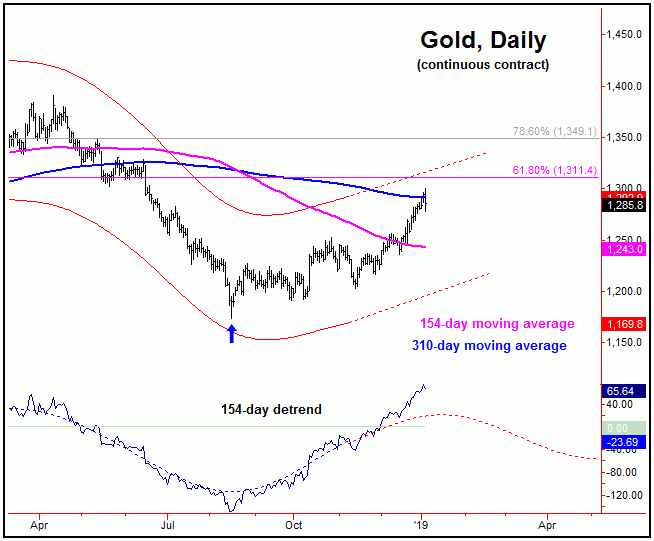
In terms of price, there is no way to know what level will top the 72/154-day rally, though there is resistance around the low-to-mid 1300's, with the next key level being the 61% retracement of the prior swing down, at the 1311 figure (chart, above). Above that, there is nothing of note until the 1349 figure, which is the 78% retracement of the same. Note that both of these price levels are at or near the upper 154-day channel line.
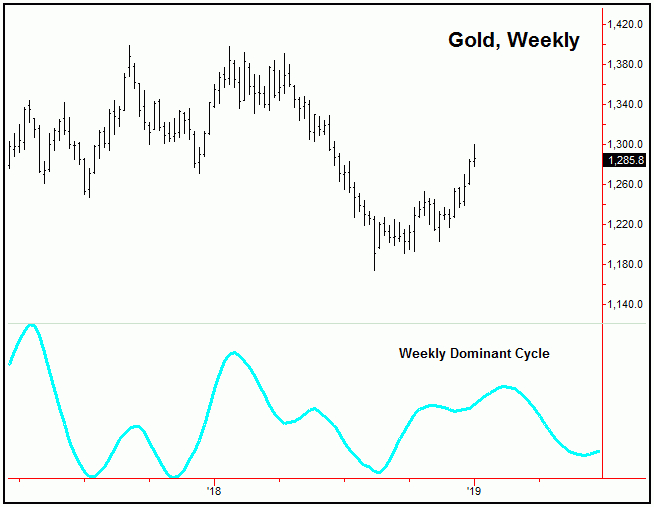
Stepping back further, from whatever high that ends up being seen with the 72 and 154-day waves, a minimum correction back to the 72 and 154-day moving averages is expected to play out into April/May, though with the decent potential for a drop on back to test the August, 2018 low of 1173. In terms of time, the 154-day trough is projected for April, while our dominant weekly cycle suggests this could stretch out into the month of May:
For the mid-term picture then, the overall bottom line calls for strength into early-to-mid February, then to be on the lookout for a semi-important peak with the 72 and 154-day time cycles. From there, a sharp decline is expected to play out into April or May, where another mid-term low should form.
Gold Timing Index
In terms of technical action, our best indicator for the mid-term is our Gold Timing Index, which is shown again on the following chart:
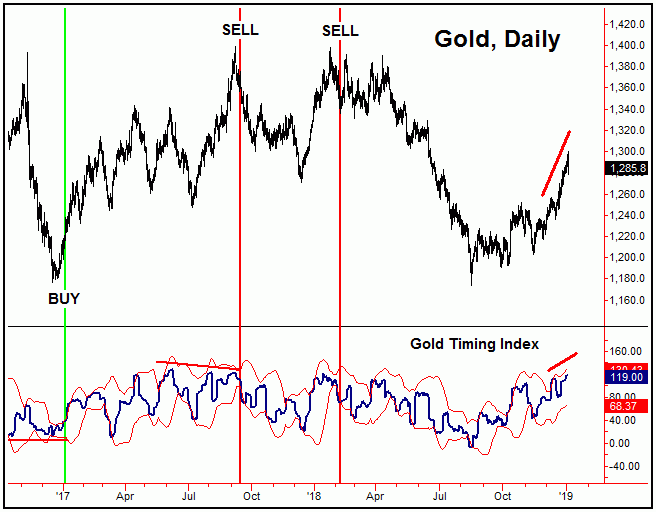
Noted in my prior article, our Gold Timing Index was showing a slight divergence against price. Having said that, this was not viewed as a bearish indication, as a divergence is only the initial condition for a mid-term sell signal. For that signal to have appeared, our indicator would have needed a daily close below its lower standard-deviation band - something which never materialized.
Going further with the above, the most recent action has negated the prior divergence with our Gold Timing Index, with the indicator actually following price to a new high. This is a bullish development going forward, and supports the idea of any correction with the smaller-degree cycles to end up as countertrend.
U.S. Stocks Update
For an update on the U.S. stock market, our call in recent months was for a sharp correction to play out into the Autumn months, one which saw the 200 and 360-day moving averages acting as magnets:
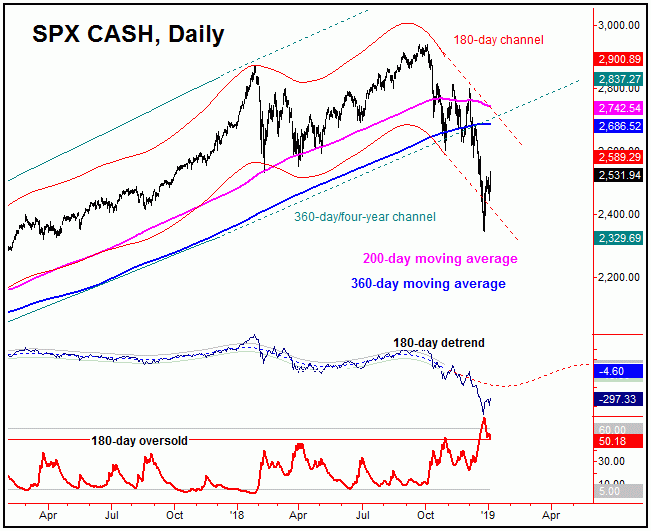
The chart above shows the action with our 180-day time cycle, which is the wave that should give us the next mid-term low for the SPX. Whether that low is yet in place remains to be seen, though the next mid-term rally is expected to come from this cycle - as well as the larger 360-day component, which is shown below:
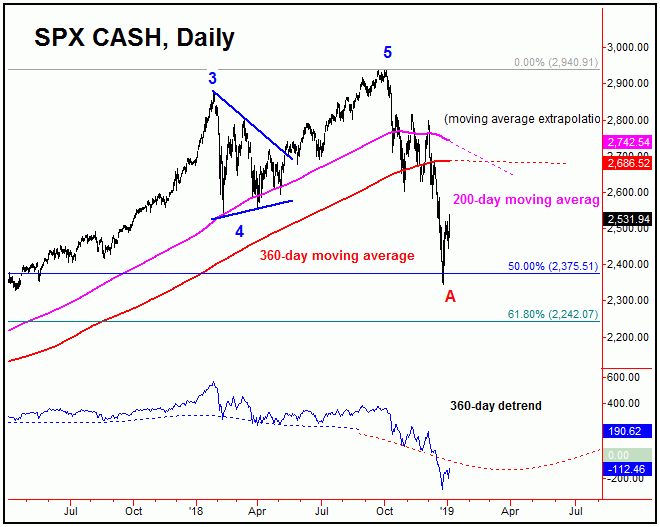
From my last article: "the SPX is working on a low with the 180-day component, though we don't know where that low will end up forming. Having said that, next key support will be around the 2375 level, which is the 50% retracement of the last four-year cycle upward phase (from 1810.10 to 2940.91). Once this wave does trough, we expect a sharp rally back to the 200-day moving average or higher in the coming weeks/months, though - depending on the closing of trading on 12/31/18 - that move looks set up to end as a larger countertrend affair."
Current analysis: As noted above, a key support level was noted at the 2375 SPX CASH figure, which was the 50% retracement of the prior bull market phase. The actual low came in at 2346, and the SPX is now seeing a sharp rally off the same, as anticipated.
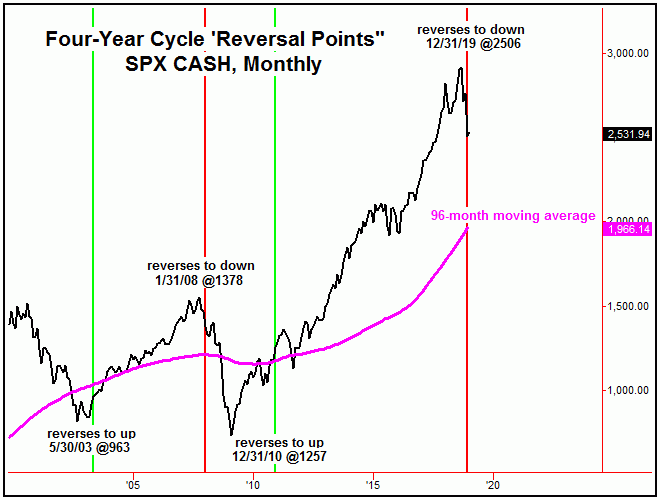
Even with the above said and noted, the downward phase of the larger four-year cycle is now confirmed to be in force, with the December (monthly) close below the 2670 SPX CASH figure. With that, we are viewing any mid-term rally with the 180 and 360-day cycles as a countertrend affair, with likely resistance around the 200-day moving average. If correct, then the patterns favor an eventual break back below the 2346 swing bottom going forward, a move which would likely end up as a larger Elliott-wave 'B'.
For the bigger picture, with the SPX closing the month of December below the 2670 figure, the same is our best indication/confirmation that the downward phase of the larger four-year cycle is in force:
With the above said and noted, the overall assumption is that the SPX is in a much larger ABC correction with the four-year cycle, with the recent decline being all or part of the first wave ('A') down. The next upward phase of the 180 and 360-day cycles should end up as the 'B' wave inside this correction, and should remain below the 2940.91 swing top, seen back in September of last year. If correct, what follows should be a final 'C' wave into what is looking to be the Autumn of 2019 or later, where a much larger low is projected to materialize.
Jim Curry
The Gold Wave Trader
http://goldwavetrader.com
http://cyclewave.homestead.com


