Gold Price Exclusive Update


Our proprietary cycle indicator is DOWN.
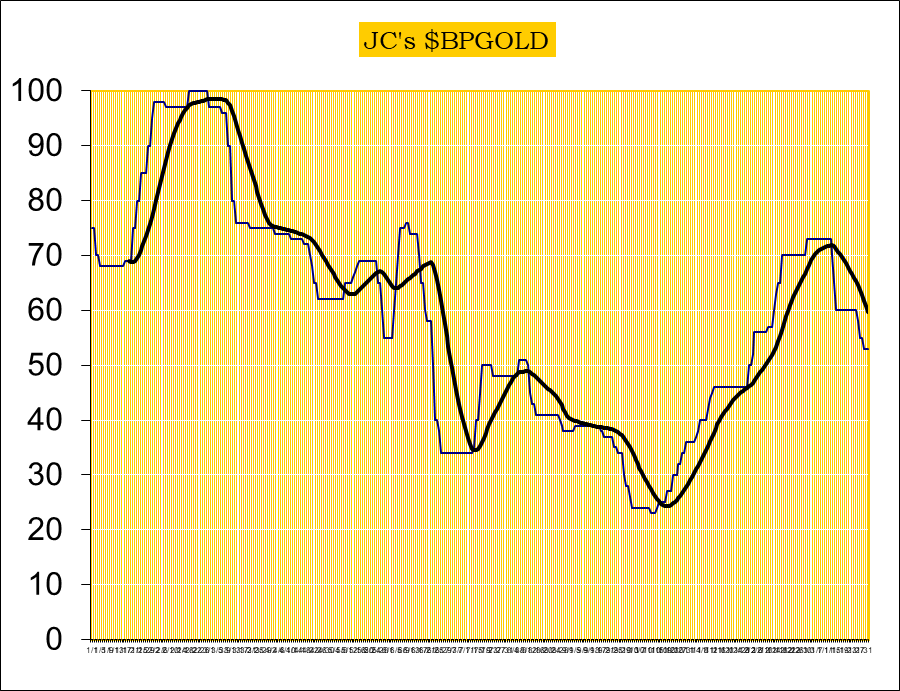
To public readers of our updates, our cycle indicator is one of the most effective timing tool for traders and investors. It is not perfect, because periodically the market can be more volatile and can result in short term whipsaws. But overall, the cycle indicator provides us with a clear direction how we should be speculating.
Investors
During a major buy signal, investors can accumulate positions by cost averaging at cycle bottoms, ideally when prices are at or near the daily 200ema.
During a major sell signal, investors should be hedged or in cash.
Traders
Simply cost average in at cycle bottoms when prices are at or near the daily 200ema; and cost average out at cycle tops when prices are above the daily 50ema.
Gold sector is now on a new long term SELL signal.
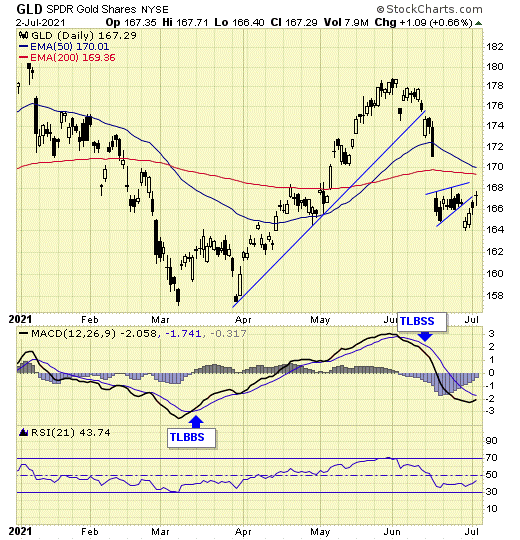
GLD is on short term sell signal.
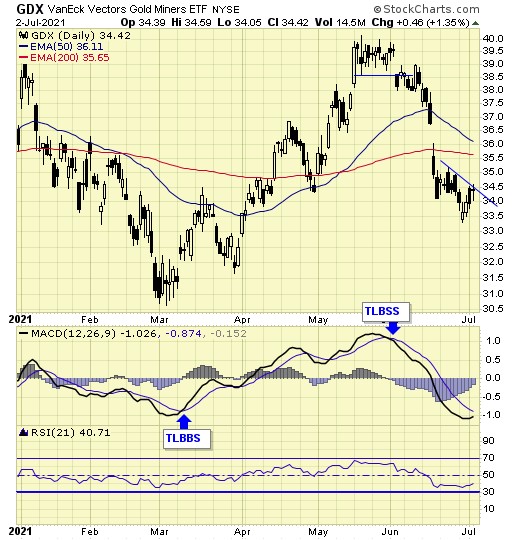
GDX is on short term sell signal.
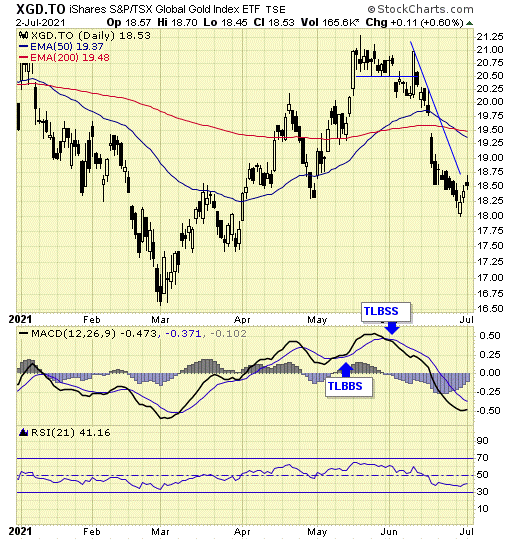
XGD.to is on short term sell signal.
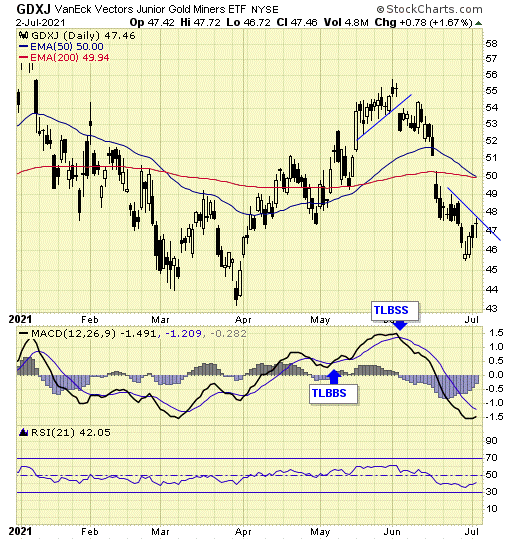
GDXJ is on short term sell signal.
Analysis
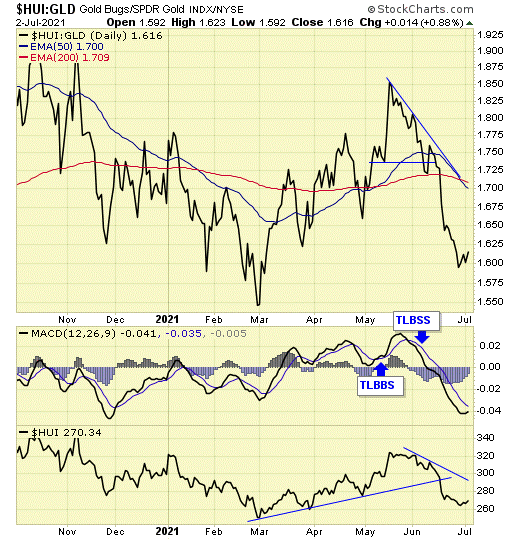
Our ratio is on sell signal.
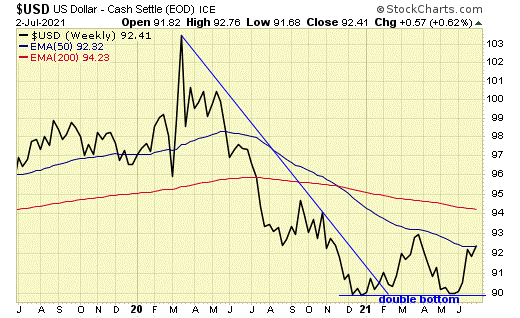
The sharp rally in USD has resulted in a double bottom.
A strong dollar is not friendly to the metals.
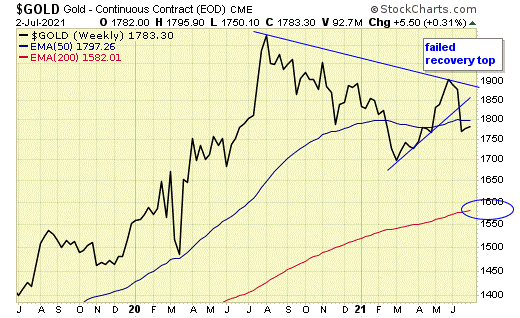
Gold broke support, confirming the $1900 level as a “failed recovery top”.
When resistance is established, prices look for support.
Major support for gold is now at the weekly 200ema, just below $1600.
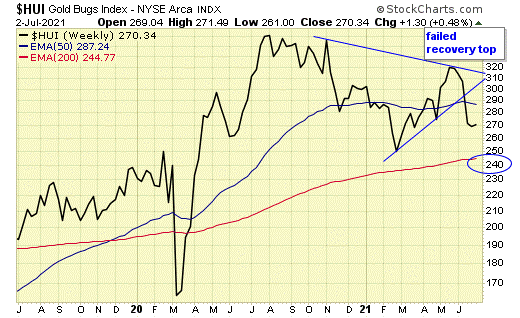
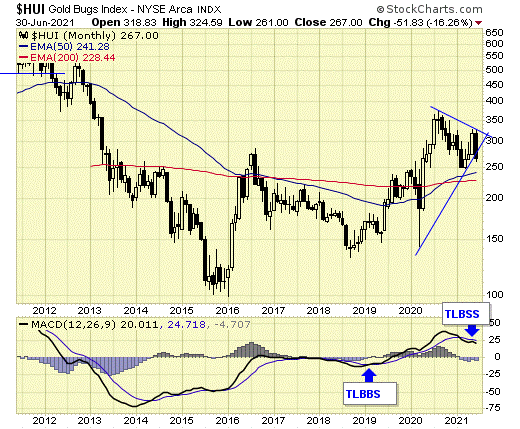
Similar to gold, $HUI also broke support, with next support at the 200ema, around 240.
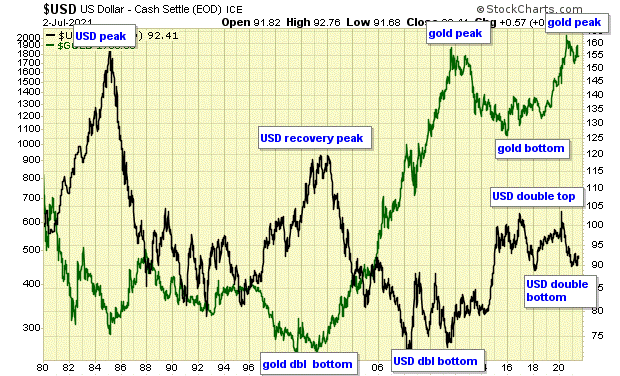
I’ve been studying this chart for over 20 years.
- In 2001, gold made a double bottom which resulted in a USD top. That was my first taste of a gold bull market and what a ride it was. A few of you oldtimers may fondly recall buying gold stocks with me such as Glamis, Bema…..
- In 2011, USD made a double bottom, and we were mostly out of the gold sector for a few years.
- USD made a double top in early 2020, and that sparked my enthusiasm for another potential gold bull market for years to come. However…
- With the sharp rally in USD, a double bottom is now in place, and that may have confirmed a gold peak.
- In order to invalidate this current prognosis, USD must break the double bottom for gold to resume the bull market, and my renewed commitment for the gold sector the long term.
Summary
Long term – on major SELL signal.
Short term – on sell signals.
Gold sector cycle is down.
$$$ We closed out all of our positions with good profits.
Disclosure
We do not offer predictions or forecasts for the markets. What you see here is our simple trading model which provides us the signals and set ups to be either long, short, or in cash at any given time. Entry points and stops are provided in real time to subscribers, therefore, this update may not reflect our current positions in the markets. Trade at your own discretion.
*********

Jack Chan is the editor of Simply Profits, established in 2006. Chan bought his first mining stock, Hoko Exploration, in 1979, and has been active in the markets for the past 37 years. Technical analysis has helped him filter out the noise and focus on the when, and leave the why to the fundamental analysts. His proprietary trading models have enabled him to identify the NASDAQ top in 2000, the new gold bull market in 2001, the stock market top in 2007, and the US dollar bottom in 2011.


