Gold Price Forecast And Stock Market Update


The gold market ended up seeing the more bullish pattern of an early-day low into support last week, with the metal hitting a bottom of 1546.00 - made in Tuesday's session. From there, strength was seen into late-week, here running up to a mid- Friday high of 1575.00 - before backing off the same to end the week with a marginal net gain.
Gold Market, Near-Term
For the very short-term, the upward phase of the 10-day cycle is seen as in force, with the next smaller-degree peak expected to come from this wave. In terms of patterns, we are currently expecting this move to end up as a countertrend affair - against the 1613.00 swing top. Take a look at our first chart:
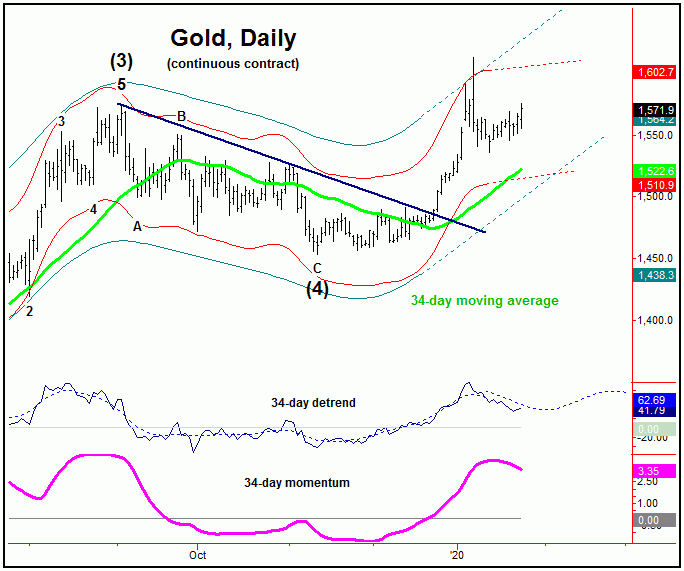
The chart above shows one of the most dominant cycles that we track, the 34-day cycle in gold. This wave is not as dominant as it has been in recent years, though its next trough is projected for the early-February timeframe. With that, we expect the short-term strength to give way to additional weakness and/or downside consolidation into that timeframe. The next bottom of significance should come from this same 34-day cycle component, with more precise details of how this bottom should play out noted in our thrice-weekly Gold Wave Trader market report.
Gold, Mid-Term Outlook
With the above said and noted in regards to the 34-day cycle, we are expecting the downward phase of that wave to end up as countertrend, and - if correct - we should see higher highs for the bigger swing on the next upward phase of that wave. In terms of price, we see the 1634-1660's acting as an eventual magnet to the upward phase of the next larger wave, the 72-day component, which is shown again on the chart below:
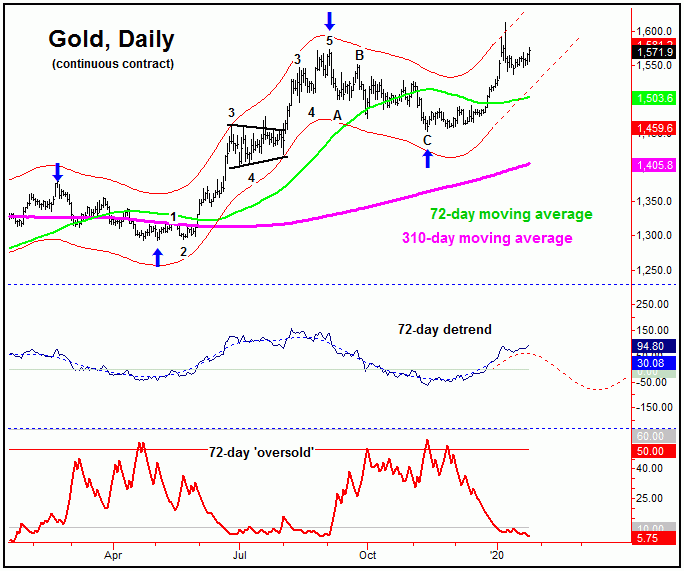
The 72-day cycle was originally seen as pointing higher into the mid-January timeframe or later, though the strength of that rally has pushed momentum considerations to favor its upward phase holding up into the mid-to-late February region. If that assessment is correct, then, as noted above, the correction phase of the smaller 34-day wave should be expected to end up as a countertrend affair.
For the bigger picture, the next high for the 72-day wave should also end up as the anticipated price peak for the larger 310-day component that we track - and thus a correction of a larger-degree should play out, following the next combination peak with these waves. From this high, we are looking for the largest-percentage decline of the year to unfold, with the exact details mentioned in our market report.
U.S. Stock Market (Update)
From my comments made in recent articles, the U.S. stock market - as measured by the S&P 500 index (or SPX) - was well into extended territory, and with that was overdue for a sharp correction off the top. In terms of time, we pinpointed the early-to-mid January range as the most likely time for stocks to peak, due to many factors, but mainly based upon seasonal and cyclic patterns.
With the above said and noted, the SPX saw a fairly decent correction into last week. Having said that, we continue to see the downside risk as being back to the 35-day moving average or lower on the SPX, though with the obvious potential for additional weakness through the same. Take a look at our next chart:
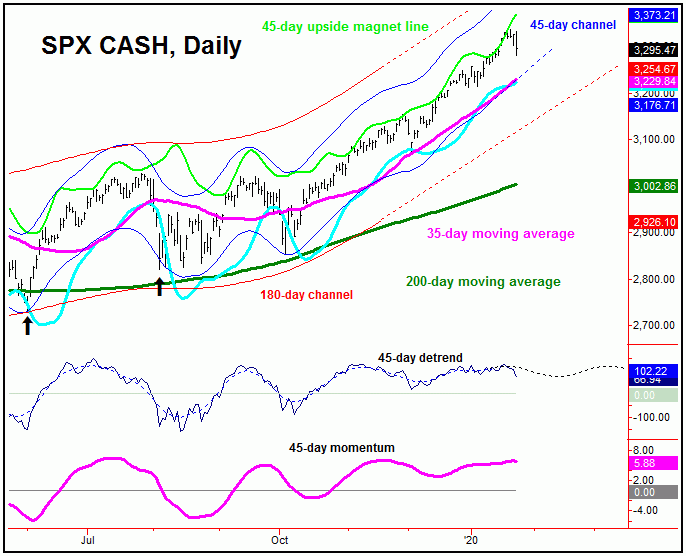
The chart above shows the 45-day time cycle that we track, as well as the 35-day moving average. Following my rule with cycles and moving averages, a dominant cycle will return back to a moving average of the same length on or before it bottoms, and thus the downside risk to that level. However, we do see the potential for additional weakness through the same, due to other technical factors, noted in our Market Turns report, which covers the U.S. stock market.
Going further with the above, the market appears to be following the script that we noted in our 2020 Forecast issue. Any decline phase with stocks is currently favored to end up as countertrend - with the mid-term cycles pointing higher into early-Spring. From there, we are expecting a much more significant peak to take hold, which should give way to a much larger percentage decline into early-Summer.
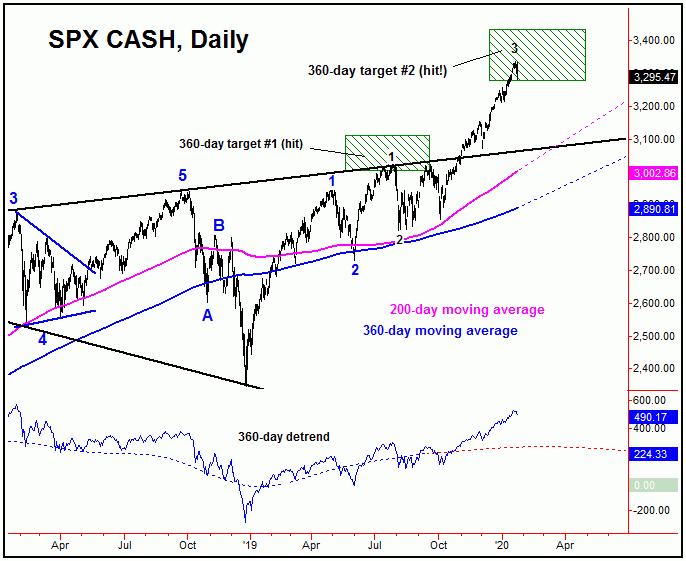
The chart above shows one of the larger waves that we track, the 360-day cycle. This wave last bottomed back in December of 2018, doing so at the 2346.58 SPX CASH figure. From there, its upward phase was confirmed to be back in force, with an initial upside target (issued last Spring) to the 3003.29 - 3112.42 SPX CASH region, and which was hit back in July, 2019. Last May, a second upside target was triggered to the 3279.07 - 3437.63 SPX CASH region, a target which - at the time - I noted would scare most stock market bears. This target has obviously been satisfied.
With the above, the next mid-term peak for stocks is expected to come from the combination of the 180 and 360-day cycles, made from higher highs than already seen - though a sharp correction is expected to play out in-between. From that high, the largest percentage decline of the year is forecast to develop, taking stocks down into a key date range that we have identified in our Market Turns report. From that low, another multi-month rally - in the range of 20% or more - should materialize.
The Overall Bottom Line
As mentioned last week, the bottom line for stocks was that a sharp correction could materialize at anytime, which we look to be in the midst of now. Even said, this decline is still expected to end up as a countertrend affair, inside a much larger bull market phase. As for the Gold market, we are looking for additional sideways-to-down action in the coming weeks, before forming the next semi-important low for the metal - prior to a strong push back to higher highs on the next swing up with the 34-day cycle. Stay tuned.
Jim Curry
The Gold Wave Trader
http://goldwavetrader.com/
http://cyclewave.homestead.com/


