Gold Price Forecast for the Final Bottom in Gold


 It’s been several weeks since our previous article on gold price predictions was published and quite a lot happened since that time, so we believe an update would be appreciated. In today’s articles we’ll do exactly that – we’ll keep you updated on our gold price forecast. In short, not much changed regarding the price, but there are some changes regarding the time.
As we wrote previously, in our daily gold trading newsletter, we usually focus on either short- or medium-term price swings, but in this essay we’ll do something quite different. We are going to analyze the gold market from the long-term perspective and we are going to focus on what’s important from the long-term point of view.
The most general and most important observation regarding gold’s performance in the last several years is that the yellow metal has been declining – it is not a one time even most gold investors had hoped it to be, but a new medium-term trend – and a quite powerful one. Major trends tend to end in a profound manner – during tops everyone wants to buy and when the bottom is formed everyone panics.
So far the rallies (even significant ones, when viewed from the short-term perspective) have just been corrective upswings that were followed by further disappointments. We haven’t seen a rally that would be strong enough to end the medium-term decline and we haven’t seen a bottom that would be accompanied by real panic among gold investors.
However, that’s not the only reason we think the final bottom in gold is still ahead of us. There are multiple other technical reasons for it, but let’s just recall 2 facts: firstly, when the European QE was announced, gold didn’t rally – it declined more than $100, and secondly, gold stocks are not outperforming (to say the least) gold in the medium term. If we had been after a major bottom, we would have expected gold to rally in light of the EU-QE announcement and gold stocks to visibly outperform the yellow metal. However, that’s not what happened – it seems that gold hasn’t declined enough for the trend to reverse.
Moreover, from the technical perspective, it’s highly unlikely that gold broke below the triangle pattern that it had been forming for about 2 years, only to decline several dollars. It’s much more likely that it was only the initial part of the final slide that we saw in the previous several weeks and the most recent move up is just a corrective upswing, not the beginning of a new trend.
So, how low will gold have to go for the final bottom to form? Let’s take a look at the long-term gold chart (chart courtesy of http://stockcharts.com).
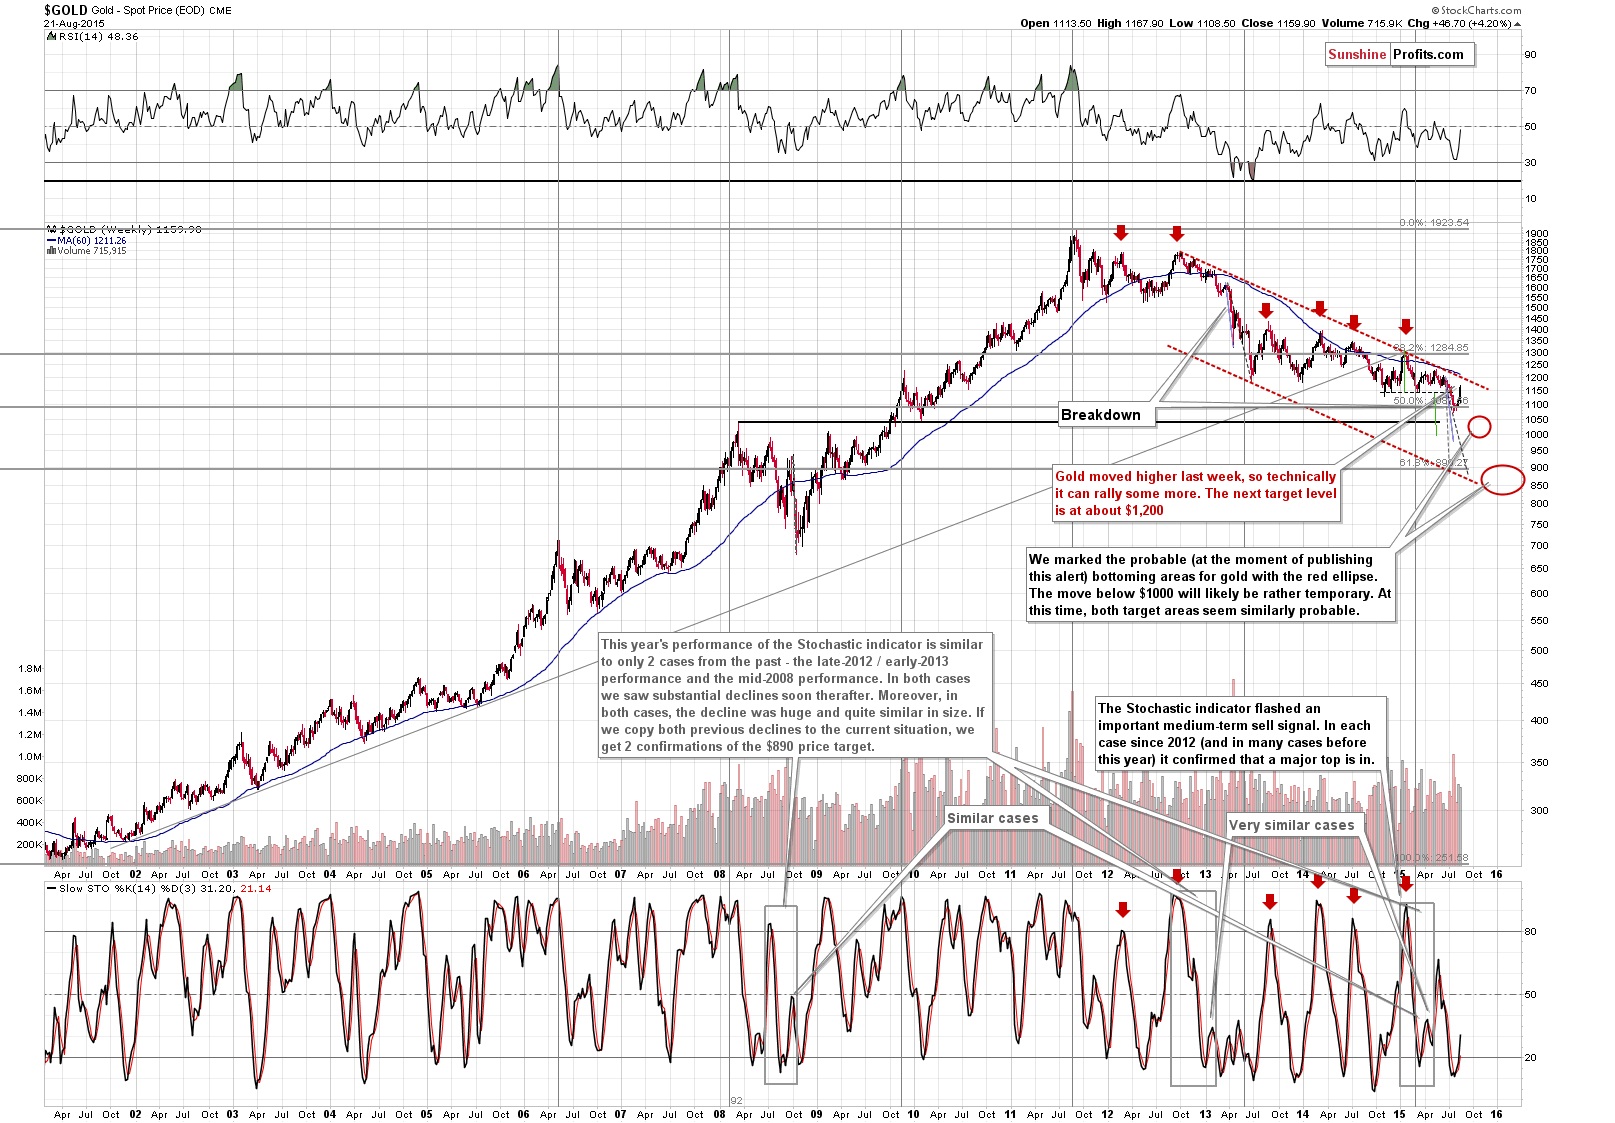
Firstly, let us emphasize that the implications of the situation in the Stochastic indicator remains up-to-date:
Several months ago we wrote that when this indicator flashed a sell signal in the overbought territory it very often meant major tops – it turned out that we were at a major top at that time. Shortly afterwards both gold and the indicator declined. The decline took place over a few weeks, taking both of them much lower.
At this point you may ask why this is significant at all. The reply is, because we saw that kind of performance 2 times previously and what happened after these situations was very, very significant. The similar cases were: mid-2008 and late-2012 / early-2013. In both cases, we saw huge declines. What’s more interesting, if we compare the post-signal declines, it turns out that they were quite similar. What’s even more interesting is that if we plot the same size of the decline on the current price on the above chart (we marked these copied declines with black and grey dashed lines), you’ll see that they both point to a decline to about the $900 level. We haven’t seen a decline that would be even similarly significant, so the above bearish signal remains in place.
Why is this level significant? Because that’s where we have the 61.8% Fibonacci retracement ($890) based on the entire bull market and also the lower border of the declining trend channel, which serves as support. Two local bottoms from 2008 and 2009 are also a little below $900.
Consequently, we have quite a few factors pointing to a final bottom close to the $890 level.
However, there are several factors that point to a different target area – the one that we have previously wrote about as the one that’s most likely to stop the final bottom – the one around $1,000 and $1,040. That’s where we have the following:
- Horizontal support based on the 2008 high and 2009 bottom.
- Psychologically important $1000 level (gold moving back into 3 digits is an important development as it might make many investors and traders view it as relatively inexpensive).
- Target based on the late-2014 – today head-and-shoulders pattern (the size of the move following the breakdown below the neck level is likely to be greater or equal to the size of the head of the pattern).
Which of the target areas is more likely to be the final bottom? Here’s our best estimate in terms of probabilities:
- 20% probability that the final bottom in precious metals is already behind us
- 35% probability that we’ll see the final bottom with gold at $1000 - $1,040
- 35% probability that we’ll see the final bottom with gold at $830 - $900
- 10% probability that we’ll see the final bottom with gold below $830.
When is the final bottom likely to take place? Our current best guess is the winter (either this year or the next). It could happen a little sooner (fall of this year) or a bit later (spring of 2016), but most likely, we’ll see the major bottom in the precious metals market in the final part of this year or early next year. If you read our previous essay with gold price predictions, you remember that we expected to see the above price levels being reached a bit earlier than what we stated above. We adjusted them based on the recent corrective rally, which will likely delay the moment when the final bottom is formed.
Fortunately, we have some time to get ready for this epic buying opportunity.
We’ll be looking for confirmations when the market moves to these levels and we’ll take action (or not) depending on what kind of confirmations and how many of them we’ll see.
Is gold likely to decline right away? It certainly could be the case, but the short-term trend is up and the most important resistance level was not reached. Gold could rally to $1,200 and still remain in a long-term downtrend – it would not invalidate the above analysis and the bearish outlook for the following months.
Before summarizing, we’d once again like to discuss one additional thing:
Are we bearish on gold?
In a way, yes, but we don’t view ourselves as “gold bears”. We’re “gold bulls” that simply think that there will be a much better opportunity to enter the market than the current situation. Consequently, we are not in the precious metals market at this time with the long-term investment capital (you can read what we mean by this kind of capital and learn more about our approach in our report on gold portfolio structuring), but we are waiting for the opportunity to enter it once again, as we think that fundamentals and the long-term trend favor MUCH higher precious metals prices.
Summing up, we think that gold prices will move much higher (in the following years), but only after it declines once again (in the following months). It seems that another bigger downswing has already started (even though gold is currently correcting) and that it will continue after additional several days or weeks. The price-volume analysis and other factors continue to favor the bearish outlook for the medium term.
Please note that the above is based on the data that was available when this essay was published and we might change our views on the market in the following weeks. In order to stay updated on our thoughts regarding the precious metals market and our free articles we suggest that you sign up to our gold mailing list – it’s free and if you don’t like it, you can unsubscribe anytime.
Thank you.
Przemyslaw Radomski, CFA
Founder, Editor-in-chief
Sunshine Profits - Silver & Gold Investment
* * * * *
Disclaimer
All essays, research and information found above represent analyses and opinions of Przemyslaw Radomski, CFA and Sunshine Profits' associates only. As such, it may prove wrong and be a subject to change without notice. Opinions and analyses were based on data available to authors of respective essays at the time of writing. Although the information provided above is based on careful research and sources that are believed to be accurate, Przemyslaw Radomski, CFA and his associates do not guarantee the accuracy or thoroughness of the data or information reported. The opinions published above are neither an offer nor a recommendation to purchase or sell any securities. Mr. Radomski is not a Registered Securities Advisor. By reading Przemyslaw Radomski's, CFA reports you fully agree that he will not be held responsible or liable for any decisions you make regarding any information provided in these reports. Investing, trading and speculation in any financial markets may involve high risk of loss. Przemyslaw Radomski, CFA, Sunshine Profits' employees and affiliates as well as members of their families may have a short or long position in any securities, including those mentioned in any of the reports or essays, and may make additional purchases and/or sales of those securities without notice.
 Przemyslaw Radomski, CFA, is the founder, owner and the main editor of SunshineProfits.com. You can reach Przemyslaw at: http://www.sunshineprofits.com/help/contact-us/.


