Gold Price Forecast: Get Ready For A Breakthrough


 Taking history into consideration, we are on the verge of change. Today’s pre-market reversal might have been the final top – but nothing is certain.
Disappointment, despair, and the need to urgently “do something to fix” the situation are all feelings that seem natural at this time, provided that one – just like me – decided to profit on the decline in the precious metals market. It’s true that the previous long position was closed profitably after we successfully exited short positions almost right at the March bottoms, but the emotional part of one’s brain tends to remember the very recent memories much more vividly.
There are signs that might make the outlook bullish, like a decisive breakout above the 2020 highs, but so far we haven’t seen them. Conversely, it’s imperative to keep in mind what happened and what didn’t happen, while staying alert to all changes that might seem really positive.
The Fed has been keeping the interest rates at ultra-low levels for many months, and it has just pledged to keep them low for a long time. The world is enduring the pandemic, and the amount of money that entered the system is truly astonishing. The savings available to investors skyrocketed. The USD Index has been beaten down from over 100 to about 90. And yet, gold is not at new highs. In fact, despite the 2020 attempt to rally above its 2011 high, gold’s price collapsed, and it invalidated the breakout above these all-important highs. It’s now trading just a few tens of dollars higher than it had been trading in 2013, right before the biggest slide of the recent years.
Something doesn’t add up with regard to gold’s bullish outlook, does it?
Exactly. Gold is not yet ready to soar, and if it wasn’t for the pandemic-based events and everything connected to them, it most likely wouldn’t have rallied to, let alone above its 2011 highs before declining profoundly. And what happens if a market is practically forced to rally, but it’s not really ready to do so? Well, it rallies… For a while. Or for a bit longer. But eventually, it slides once again. It does what it was supposed to do anyway - the only thing that changes is the time. Everything gets delayed, and the ultimate downside targets could increase, but overall, the big slide is not avoided.
Let’s say that again. Not avoided, but delayed.
Gold Price Technicals
That’s what we can infer from looking at the entire landscape, but what can we infer from the day-to-day price movements and the latest technical developments?
In yesterday’s (May 17) intraday analysis, I wrote the following:
Based on today’s pre-market upswing, gold might reach its declining medium-term resistance line (~1,860) any hour now, which might seem like a very bullish development until one considers the following:
1. Based on the self-similarity to 2012, that’s exactly what gold “should” do right before topping and sliding.
2. This move would make the size of the current rally practically identical to the rally from late 2020 to early 2021, which was followed by a sharp slide.
3. We have a short-term triangle-vertex-based reversal in the junior miners early this week, so we would likely see some kind of reversal anyway, and since the current move is up, we’re likely to see a top shortly.
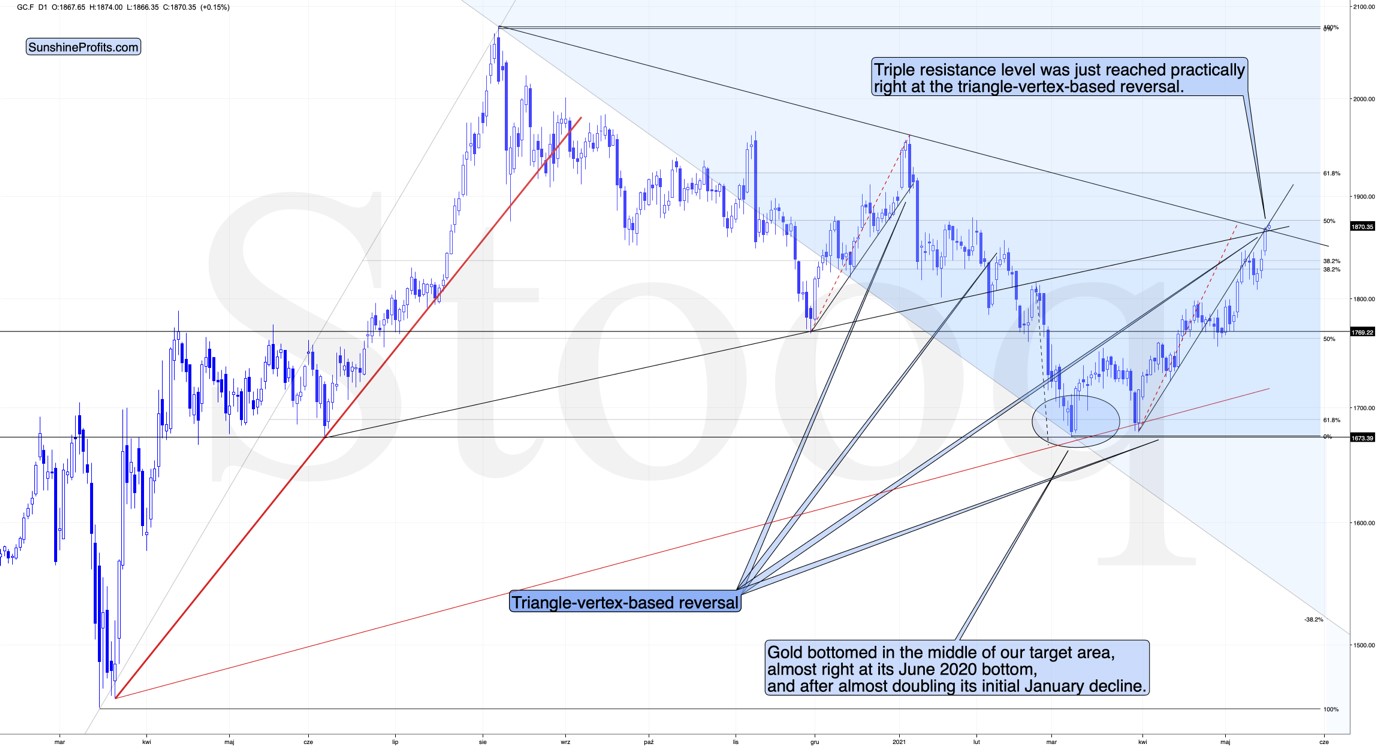
At the moment of writing these words, gold’s intraday high is $1,867.50 – right at the intersection of three resistance lines and the triangle-vertex-based reversal.
At the same time, the size of the recent upswing is almost identical to the size of the rally that preceded the early-2021 top. Consequently, it’s highly likely that what we see right now is the final reversal that we’ve been waiting for.
To be precise, there are two triangle-vertex-based reversals aligned next to each other. One was yesterday, and the other is today. Today’s reversal point is based on the rising support line based on the June and November 2020 bottoms, while the declining resistance line is based on the August 2020 and January 2021 tops. Today’s reversal is grounded on more important lines, so its indication is more profound.
So far today, we’ve seen a reversal in gold after gold moved very close to its mid-January highs and the 50% Fibonacci retracement based on the August 2020 – March 2021 decline.
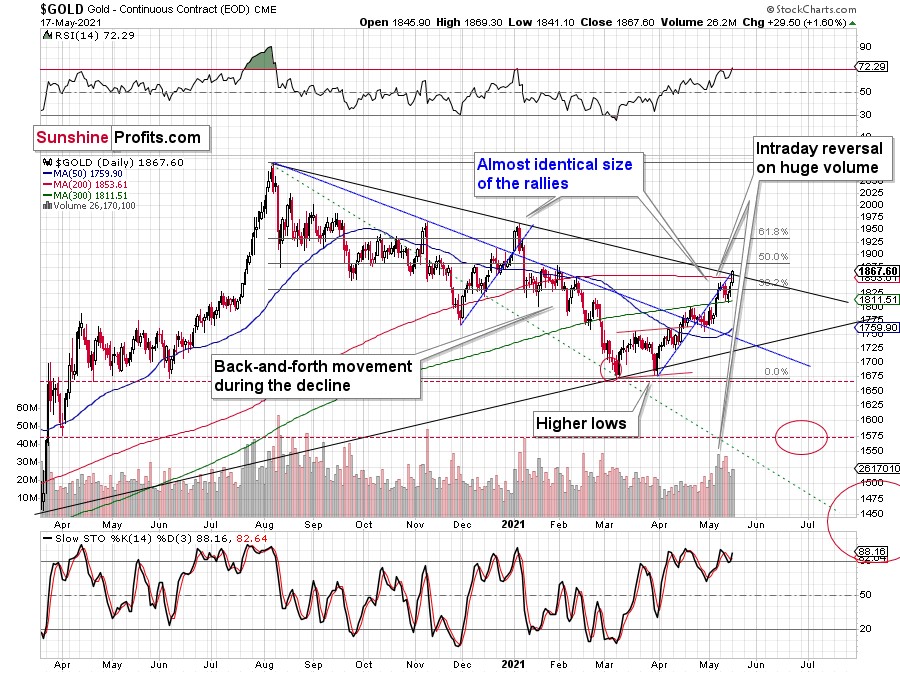
The sizes of the current rally (taking the second March bottom as the starting point) and the rally that ended at the beginning of this year are practically identical at the moment.
Just as the rallies from early 2012 and late 2012 (marked with blue) were almost identical, the same could happen now.
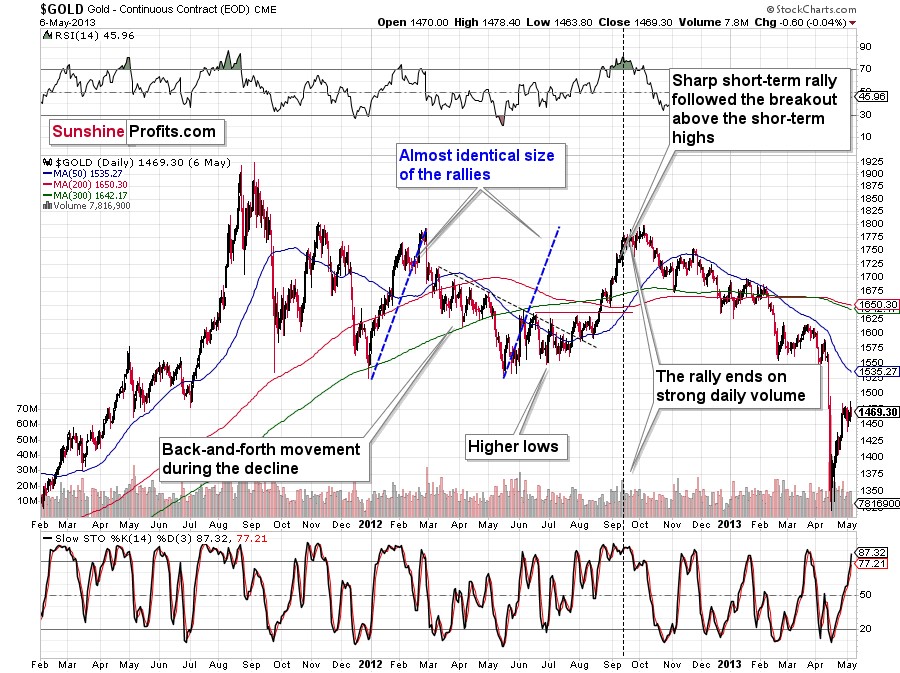
The March 2021 low formed well below the previous low, but as far as other things are concerned, the current situation is similar to what happened in 2012.
The relatively broad bottom with higher lows is what preceded both final short-term rallies – the current one, and the 2012 one. Their shape as well as the shape of the decline that preceded these broad bottoms is very similar. In both cases, the preceding decline had some back-and-forth trading in its middle, and the final rally picked up pace after breaking above the initial short-term high.
Interestingly, the 2012 rally had ended in huge volume, which is exactly what we saw on Friday. To be 100% precise, the 2012 rally didn’t end then, but it was when over 95% of the rally was over. Gold moved very insignificantly higher since that time. Most importantly, though, it was the “dollars to the upside, hundreds of dollars to the downside” situation. And it seems that we are in this kind of situation right now once again.
Interestingly again, back in 2013 gold started its gargantuan (…) slide from about $1,800 and it is not far from this level also today.
Moreover, let’s keep in mind that the RSI indicator just topped slightly above 70, which is what tends to happen when gold tops. The upside seems very limited. In fact, it seems that the top in gold is already in.
The Reversal of the USD Index
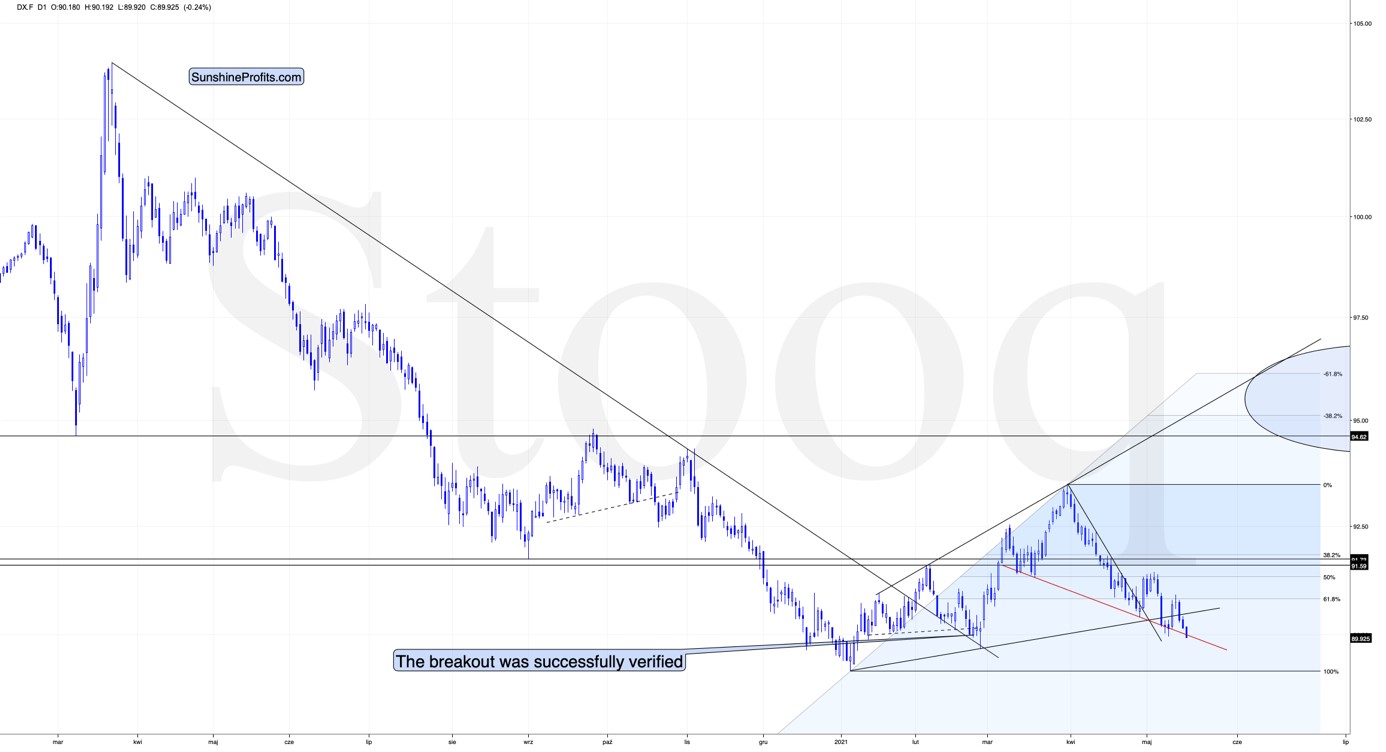
Gold is already reversing while the USD Index is not. Gold has likely topped, while the USDX is likely to reverse shortly. Today is the third session below the rising support line and another intraday attempt to move below the declining red support line (neckline of the potential head and shoulders pattern). Earlier this month, the USDX reversed and rallied precisely then – after three days below the rising support line.
To explain, I wrote on May 11:
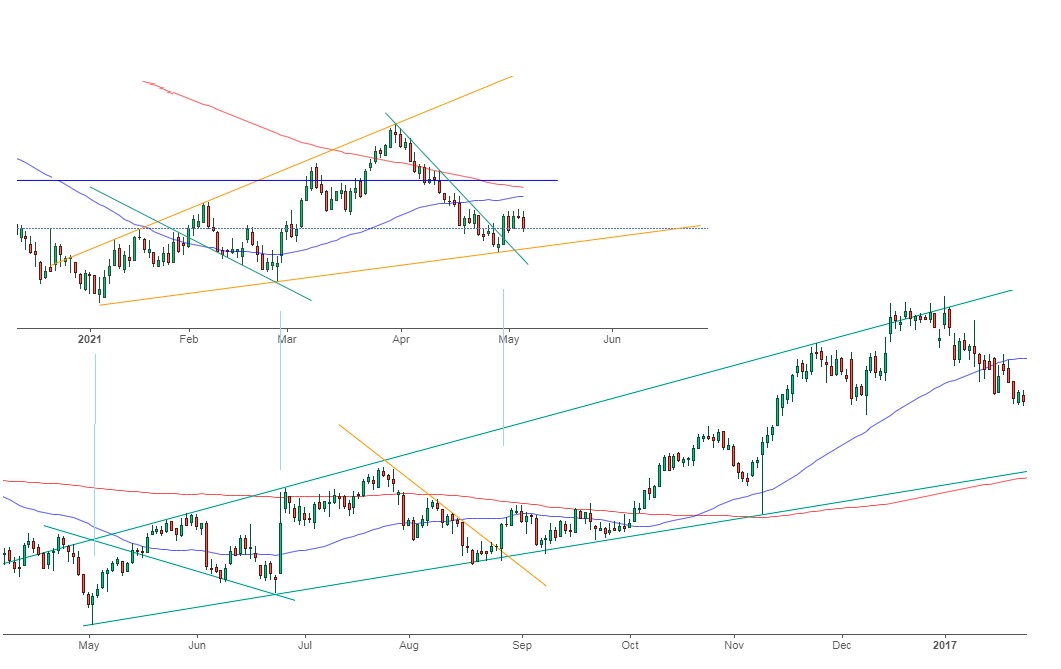
While the self-similarity to 2018 in the USD Index is not as clear as it used to be (it did guide the USDX for many weeks, though), there is also another self-similar pattern that seems more applicable now. One of my subscribers noticed that and decided to share it with us (thanks, Maciej!).
Here’s the quote, the chart, and my reply:
Thank you very much for your comprehensive daily Gold Trading Reports that I am gladly admitting I enjoy a lot. While I was analyzing recent USD performance, (DX) I have spotted one pattern that I would like to validate with you if you see any relevance of it. I have noticed the DX Index performing exactly in the same manner in a time frame between Jan. 1, 2021 and now as the one that started in May 2016 and continued towards Aug. 16. The interesting part is not only that the patterns are almost identical, but also their temporary peeks and bottoms are spotting in the same points. Additionally, 50 daily MA line is almost copied in. Also, 200 MA location versus 50 MA is almost identical too. If the patterns continue to copy themselves in the way they did during the last 4 months, we can expect USD to go sideways in May (and dropping to the area of 90,500 within the next 3 days) and then start growing in June… which in general would be in line with your analysis too.
Please note the below indices comparison (the lower represents the period between May-Dec 2016 and higher Jan – May 2021). I am very much interested in your opinion.
Thank you in advance.
And here’s what I wrote in reply:
Thanks, I think that’s an excellent observation! I read it only today (Monday), so I see that the bearish note for the immediate term was already realized more or less in tune with the self-similar pattern. The USDX moved a bit lower, but it doesn’t change that much. The key detail here would be that the USDX is unlikely to decline much lower, and instead, it’s likely to start a massive rally in the next several months - that would be in perfect tune with my other charts/points.
I wouldn’t bet on the patterns being identical in the very near term, though, just like the late June 2016 and early March 2021 weren’t that similar.
As soon as the USD Index rallies back above the rising support line, the analogy to 2016 will be quite clear once again –the implications will be even more bullish for the USDX and bearish for the precious metals market for the next several months.
Please note that back in 2016 there were several re-tests of the rising support line and tiny breakdowns below it before the USD Index rallied. Consequently, the current short-term move lower is not really concerning, and forecasting gold at much higher levels because of it might be misleading. I wouldn’t bet on the silver bullish forecast either.
So, why has gold rallied recently? Quite likely to complete the similarity to 2012. As it has already achieved this goal, the price of the yellow metal seems ready to slide once again, taking the rest of the precious metals market (especially the junior mining stocks) along with it.
GDX and GDXJ
Speaking of junior mining stocks, unlike GDX, the GDXJ didn’t move to new yearly highs yesterday.
The GDX ETF soared to new highs on volume that was much greater than 40M shares. This happened only three times in the past 12 months. In each of those three cases, it was a major top, or it was very, very close to it.
The RSI just moved above 70, and it happened only twice recently. One time it heralded the 2020 top, and the other time we saw it in late February 2020 – right before a huge slide started.
This is a very bearish combination of factors, and the linkage wasn’t accidental, as we saw something similar in the GDXJ ETF.
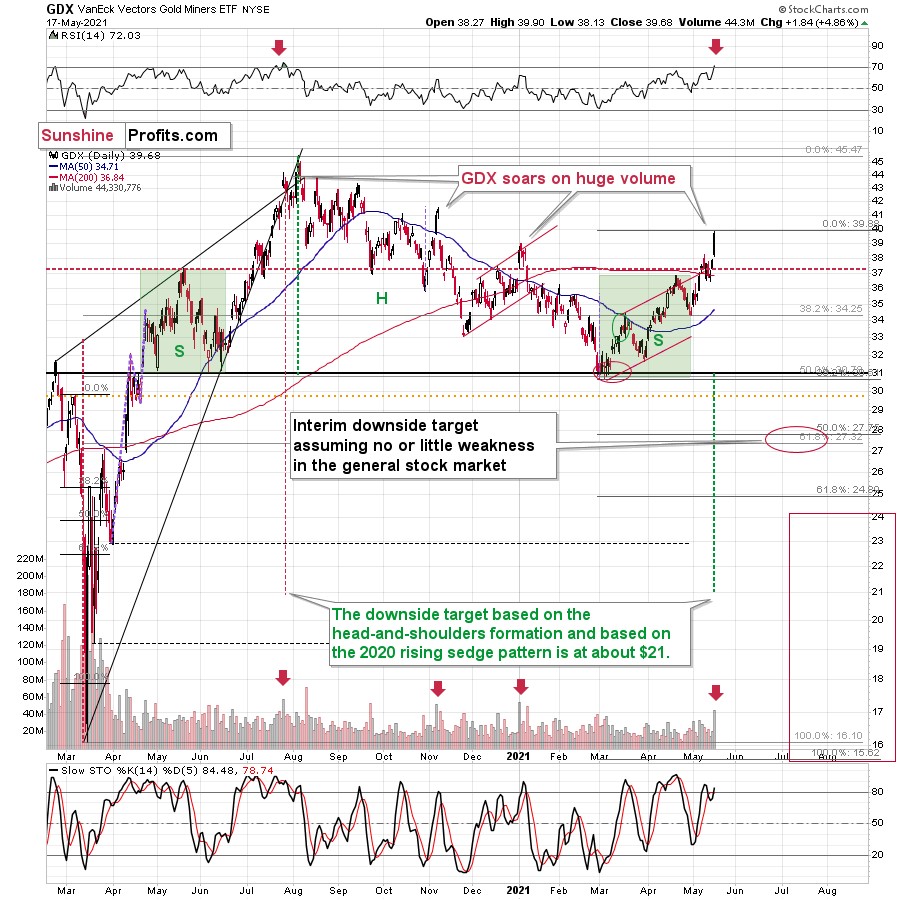
On the above chart, the big daily volumes are marked with horizontal, dashed lines. In most cases in general, and in all cases after sizable rallies, this meant that the top was in.
It’s also notable that while yesterday’s session took junior miners higher, it didn’t take them back above the thick neck level of the previously broken head-and-shoulders pattern. So, the implications thereof remain bearish.
Consequently, taking all the above into account, it seems to me that the situation in the precious metals market is very bearish right now, as it seems to be either topping or after the top. If I didn’t have a short position in the junior mining stocks right now, I would have opened it today.
Summary
To summarize, even though it doesn’t seem to be the case based on this month’s price change in gold, it seems that the yellow metal’s days are numbered. This is based not only on the excessively oversold USD Index and its 2016 self-similar pattern but also on what’s happening in the stock market, silver’s recent outperformance and price levels reached throughout the precious metals sector.
Taking that into consideration, gold’s corrective action is pretty much over (or just about to be), and the weeks that follow are not likely to be pleasant times for anyone who jumps on the bullish bandwagon just because prices moved higher in the previous days or months or based on some forum posts. Tread carefully.
What’s profitable is rarely the thing that feels good initially. As silver often moves in close relation to the yellow metal, forecasting gold’s longer term rally without a bigger decline first is thus likely to be misleading. Silver is likely to slide as well. The times when gold is continuously trading well above the 2011 highs will come, but they are unlikely to be seen without being preceded by a sharp drop first.
Thank you for reading our free analysis today. Please note that it is just a small fraction of today’s all-encompassing Gold & Silver Trading Alert. The latter includes multiple premium details such as the outline of our trading strategy as gold moves lower.
If you’d like to read those premium details, we have good news for you. As soon as you sign up for our free gold newsletter, you’ll get a free 7-day no-obligation trial access to our premium Gold & Silver Trading Alerts. It’s really free – sign up today.
Przemyslaw Radomski, CFA
Founder, Editor-in-chief
Sunshine Profits - Effective Investments through Diligence and Care
* * * * *
All essays, research and information found above represent analyses and opinions of Przemyslaw Radomski, CFA and Sunshine Profits' associates only. As such, it may prove wrong and be subject to change without notice. Opinions and analyses are based on data available to authors of respective essays at the time of writing. Although the information provided above is based on careful research and sources that are deemed to be accurate, Przemyslaw Radomski, CFA and his associates do not guarantee the accuracy or thoroughness of the data or information reported. The opinions published above are neither an offer nor a recommendation to purchase or sell any securities. Mr. Radomski is not a Registered Securities Advisor. By reading Przemyslaw Radomski's, CFA reports you fully agree that he will not be held responsible or liable for any decisions you make regarding any information provided in these reports. Investing, trading and speculation in any financial markets may involve high risk of loss. Przemyslaw Radomski, CFA, Sunshine Profits' employees and affiliates as well as members of their families may have a short or long position in any securities, including those mentioned in any of the reports or essays, and may make additional purchases and/or sales of those securities without notice.
********
 Przemyslaw Radomski, CFA, is the founder, owner and the main editor of SunshineProfits.com. You can reach Przemyslaw at: http://www.sunshineprofits.com/help/contact-us/.
More from Gold-Eagle


