Gold Price Forecast: Gold to Lead Says Key Ratio
 share
share
 share
share
 share
share
 share
share
 share
share

One of the key ratios for precious metals investors to understand is the Dow to gold ratio. The Dow to gold ratio asks: “How many ounces of gold does it take to purchase one share in each company in the Dow Jones Industrial Average?” The higher the ratio, the stronger Dow stocks are performing relative to gold. The lower the ratio, the stronger gold is performing relative to the Dow.
In other words, the Dow to gold ratio measures the relative worth of mainstream stocks versus gold, the age-old store of wealth.
Presently the ratio stands at 19 to 1, with the Dow at 34160 and gold at $1,800 per ounce. What is coming next for the ratio? Will gold increase or decrease compared to mainstream stocks?
We have strong reason to believe that a significant move lower in the ratio is due ahead. In other words, gold should be gaining value relative to the Dow, and quite soon.
The Dow to Gold Ratio Long-Term
First, let us examine the long-term chart of the Dow to Gold ratio. Below the data is presented from 1976 through present:
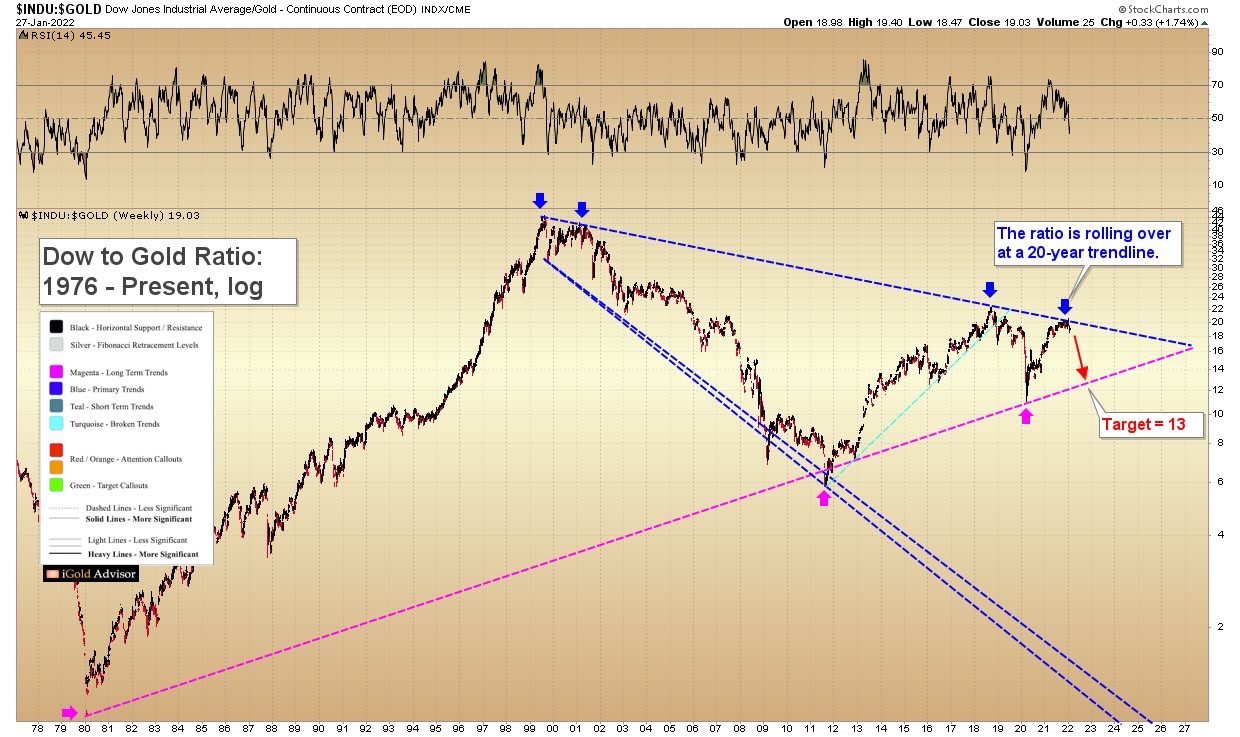
Note how the ratio is presently bumping up against a 20-year downtrend (blue annotation). Fortunately for gold investors, we see evidence that the ratio is thus rolling over. After all, trends are considered valid until proven otherwise. And in this case, we see no evidence that the ratio is breaking upward in favor of the Dow. Instead, we see it starting to decline in favor of gold.
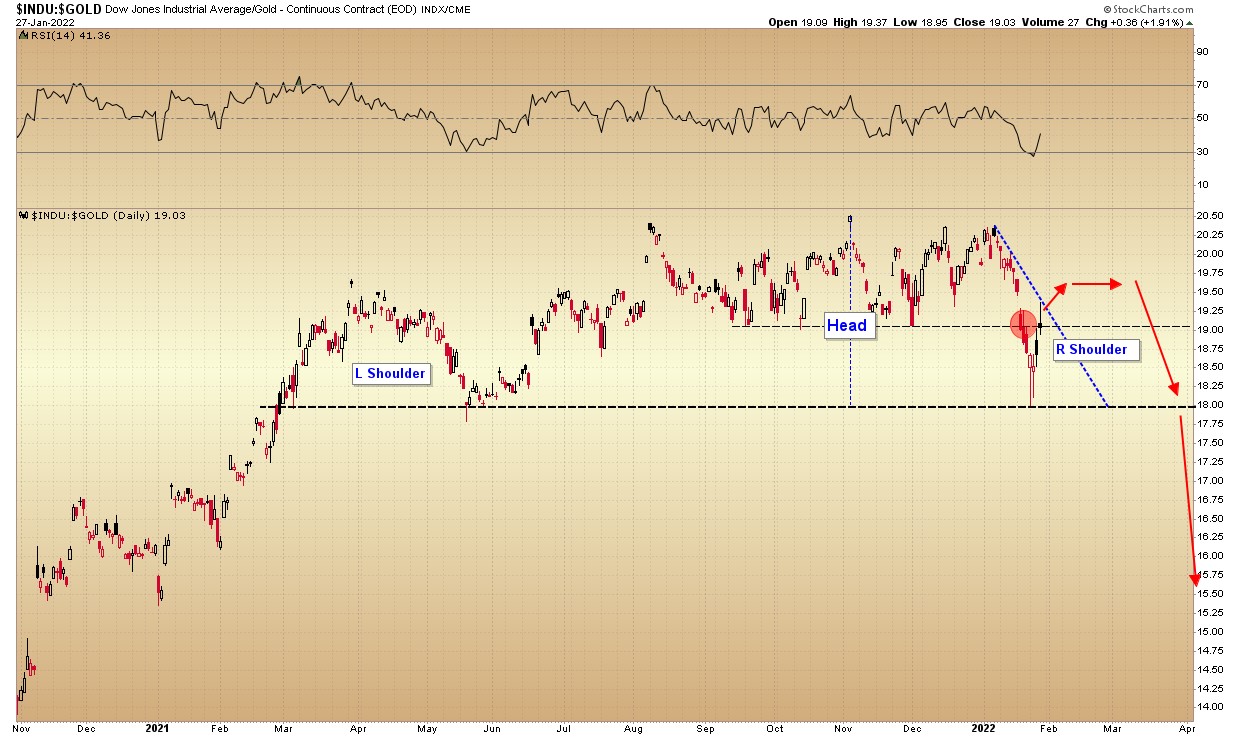
The Dow to Gold Ratio Zoomed-In
Zooming the Dow to gold ratio in to the last year reveals a classic topping pattern: a head and shoulders formation (blue), which bears its name from a loose resemblance to a human silhouette, with a more prominent head sticking out above two shoulders.
Note the right shoulder now in formation, above the 18 horizontal support (black). Once this 18 level is broken to the downside, we should expect the ratio to begin to plummet precipitously.
How Low in Favor of Gold?
How low will the ratio fall after it breaks the 18 level?
Let us refer back to the long-term chart.
Our best expectation is that the Dow to gold ratio will fall at least down to 13 within the next year, after it breaks the 18 support.
We can see that a 40+ year trend exists in the 13 region (magenta line). Again, trends are valid until proven otherwise.
There will be a major long-term battle that happens once the ratio declines to 13, as the chart reveals a pennant triangle consolidation dating back to 1980 that is due to be resolved.
This longer-term resolution is a discussion for another day. For now, we have solid evidence that the ratio is due to decline in 2022 from its current level at 19 down to approximately 13, in favor of gold.
Projections for the Dow and Gold
From 19 down to 13 represents a 31.5% underperformance for the Dow versus gold in 2022. How could this play out?
Likely scenarios:
- Gold rises, Dow flat: the Dow stays flat at 34160 while gold advances to $2,627 per ounce. This scenario would be expected in an inflationary scenario.
- Gold flat, Dow falls: Gold remains at $1,800 per ounce and the Dow falls to 23400. This scenario would be expected in a deflationary scenario.
Less likely but still possible scenarios:
- Both rise: the Dow rises to 40000 while gold advances to $3,076. While the Dow advances in this scenario, gold outpaces it. This would be expected in a higher-inflation scenario, or a prelude to hyperinflation.
- Both fall: the Dow crashes to 17080, a massive 50% fall. Meanwhile, gold declines to $1,313. While this is still a correction for gold, it is only 23%; thus, gold holds its value better than the Dow. This would be expected in a true market panic.
Takeaway on the Dow to Gold Ratio
We have strong evidence that gold is set to outpace the Dow in 2022, down to a ratio of 13. This could happen in a number of scenarios; however, the key is that gold will be gaining more and/or holding its value better than the Dow in 2022, no matter how the compression plays out.
At www.iGoldAdvisor.com, we are preparing to purchase several gold-related investments amidst any final selling into the coming low. In addition to open market trades, we plan to make highly-leveraged investments via private placements, which offer investors free warrants in gold mining companies in addition to their shares.
Wise investors will be using this period of calm in gold to position for it to outpace the Dow during the remainder of the year. What happens in 2023 and beyond will be featured in future analysis; however, 2022 is going to be a year for gold to shine.
********
share
share
share
share
share

Christopher Aaron began his career as an intelligence analyst for the CIA and Department of Defense. He served two tours to Afghanistan and Iraq between 2006 - 2009, conducting pattern-of-life mapping for military leaders.
Mapping shares similarities with technical analysis of the financial markets because both involve the interpretation of repeating patterns found in human nature. He is the founder of iGold Advisor, providing independent research and analytics on all aspects of the precious metals markets.
He speaks regularly on the cyclical patterns found within the financial markets and on international policy. He has been featured in the New York Times and NPR news amongst other financial publications.


