Gold Price Forecast: Gold's Mid-Term Cyclical Picture


 Recapping Last week
Last week's trading saw Gold forming its low in Wednesday's session, here doing so with the tag of the 1701.70 figure. From there, a decent rally was seen into late-week, with the metal pushing all the way up to a Friday high of 1740.50 - before backing off the same into the daily/weekly close.
Gold Market, Short-Term
From the comments made in recent articles, Gold has been looking for a rally - with the last short-term correction having come as a result of the 10, 20 and 34-day cycles that we track. The chart below shows the smallest of these waves, the 10-day cycle:
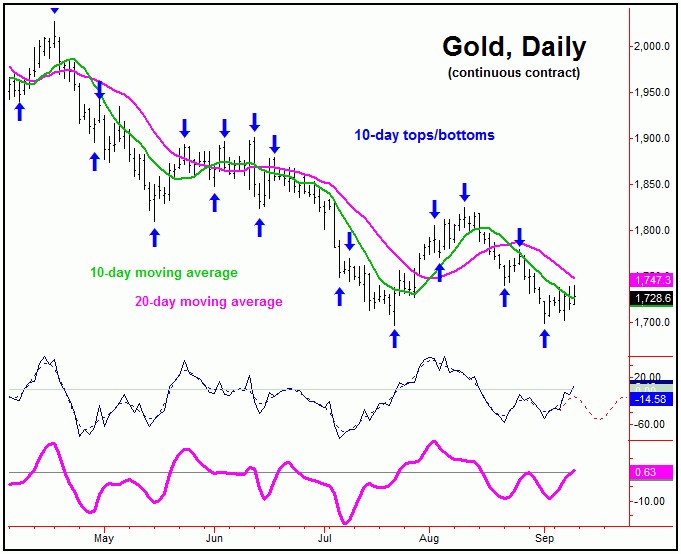
With the recent action, the upward phase of at least this 10-day wave has been in force off the early-September low, though more telling action will come from the larger two cycles, the 20 and 34-day waves, with the larger 34-day shown below:
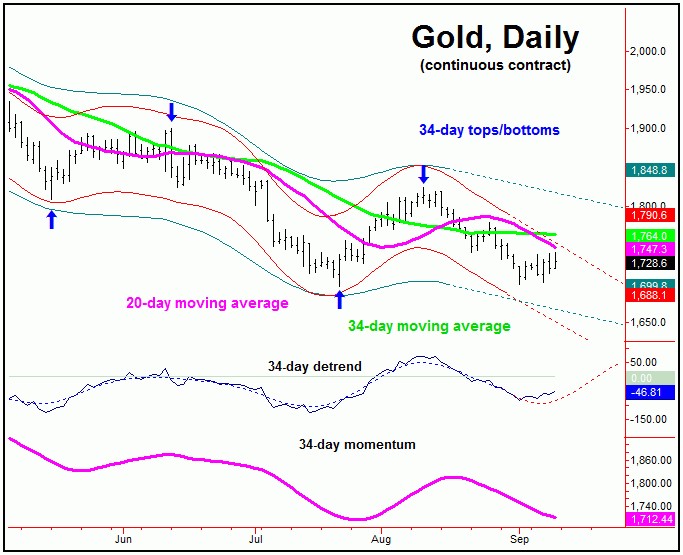
From the comments made in past articles, back in August we were looking for a key short-term peak to form in the Gold market, with resistance to the move noted at the 1824-1833 region, and with the actual peaking coming in at the 1824.60 figure. From that high - into the most recent low - the metal fell some 125 points, or approximately 6.8% from peak-to-trough.
With the above said and noted, whether the bottom for the 34-day cycle is yet in place is still speculation at this point, with the detrend that tracks this wave projecting its low in the current timeframe - but with price still holding the short-term (price) action inside our 34-day cycle channel.
Once the low for this wave is complete, we are expecting a decent rally playing out into later this month, though a move which is now assumed to end up as countertrend, due to the configuration of our next larger wave, the 72-day component:
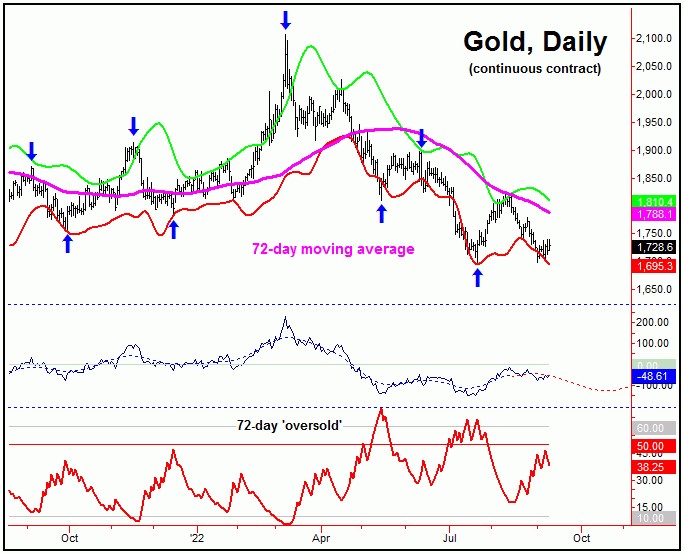
With the overall action, the probabilities favor the downward phase of this 72-day cycle to be in force, off the left-translated peak made back in mid-August. With that, as noted, the probabilities tend to favor any short-term rally with the smaller 10, 20 and 34-day cycles to end up as countertrend.
Stepping back further, a countertrend peak made later this month would be expected to give way to weakness again - and lower lows for the swing - into mid-October, where our 72-day component is next projected to trough. That low is also expected to end up as our next mid-term bottom, coming from the larger 310-day wave.
Gold's, Mid-Term Picture
For the mid-term picture, as mentioned in past articles, the next bottom of significance is expected to come from the combination of 72 and 310-day cycles - with the larger 310-day cycle shown again on the chart below:
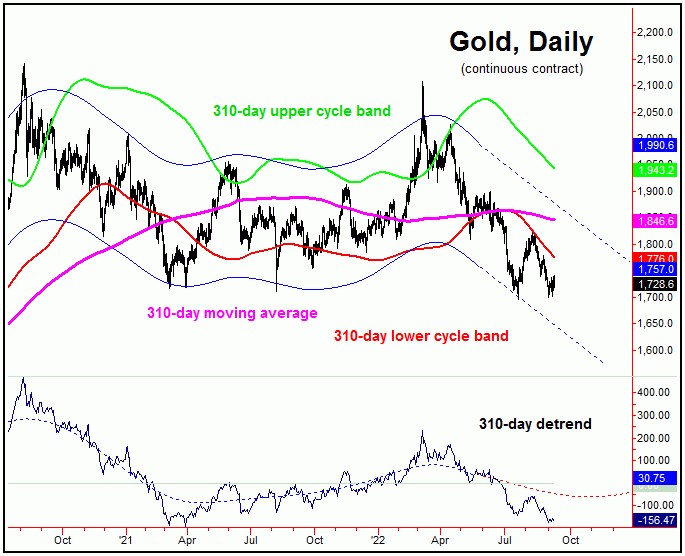
In terms of time, this 310-day cycle is next projected to trough around mid-to-late October, which is right into the overall range where our next 72-day low is due. From whatever bottom that does form these waves, the probabilities will favor a sharp rally of some 20-25% or more playing out in the months to follow - with the upper 310 cycle band acting as the magnet.
In terms of time, the next mid-term rally phase - once in force - would favored to take Gold higher overall into the late-Spring of next year, before setting up for another sharp decline into the following 310-day cycle bottom, due into the late-2023 to early-2024 timeframe. More on all as we continue to move forward.
Jim Curry
The Gold Wave Trader
http://goldwavetrader.com/
http://cyclewave.homestead.com/
********


