Gold Price Forecast: Stocks’ Demise To Impact Gold


There are two primary drivers of gold’s price: the USD Index and real interest rates. However, it doesn’t mean that other markets don’t impact the precious metals market at all. Conversely, at times, the key trigger for a certain might come from a different market. Or it could be the case that the shape of the decline is determined by what happens in other related markets – in particular in the general stock market.
It seems that right now the relationship between the general stock market and the precious metals market covers both above-mentioned aspects. First, let’s keep in mind that almost one year ago gold plunged along with the stock market, and that silver and mining stocks were affected the most. Why was that the case? Most likely, because of the same reason why silver and miners declined the most in 2008 – because the general stock market declined.
So, looking at the developments in the S&P 500 and other stock market indices should be quite useful even if you’re interested in gold, silver and/or mining stocks only.
That’s why in today’s analysis I’ll focus on some of the most important non-technical signs that we get for the stock market. Long story short: stock bulls – beware. And now for the full picture:
Walking a Tightrope
For weeks, I’ve been warning that excessive speculation could lead to a significant drawdown of U.S. equities. And given their strong-to-moderate correlation with the S&P 500, the negativity would likely cascade across the precious metals’ market.
On Jan. 20, I wrote that fund managers’ cash positions hit their lowest level since 2013 (the red circle below).
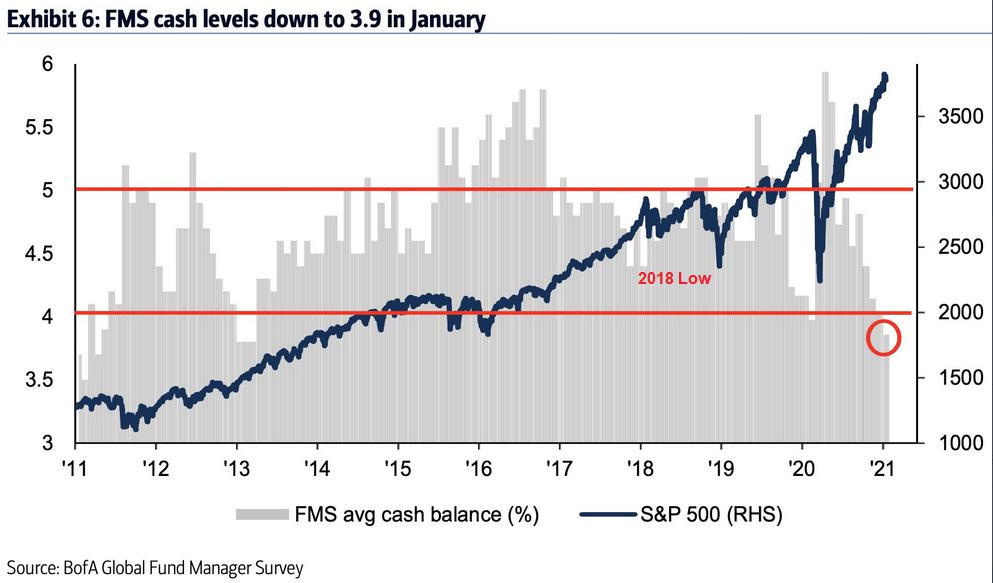
To explain, long-only institutional investors (like mutual funds) often keep 4% to 5% of their portfolios in cash (the horizontal red lines above). However, the vertical gray bars represent cash positions at different points in time. For context, the smaller the bar, the less cash they’re holding. And if you analyze the gray bar intersecting with the red circle, it’s another sign of the euphoric times.
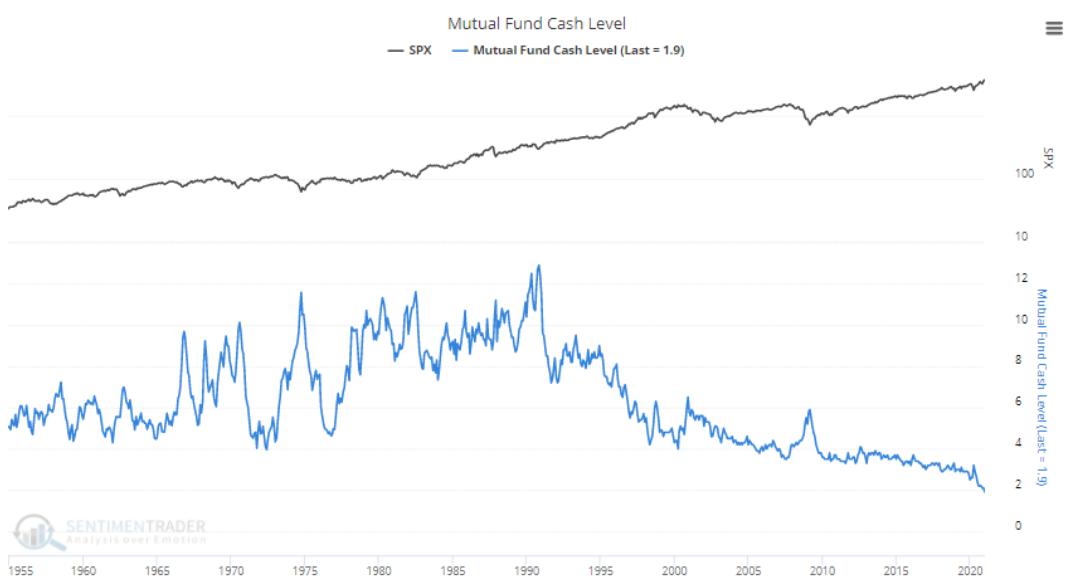
But turning it up a notch, mutual fund managers are now holding less than 2% of their portfolios in cash – an all-time low.
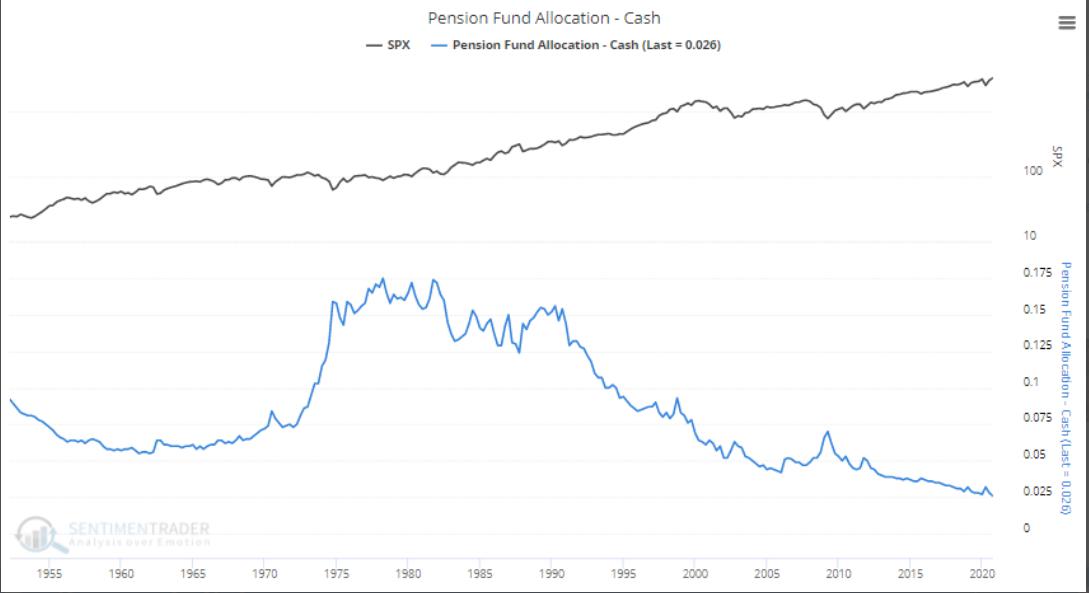
Moreover, with fear of missing out (FOMO) taking a sledgehammer to valuation, pension funds are also following the bad behavior. If you analyze the chart below, you can see that pension fund cash positions have fallen to 2.6% – also an all-time low.
Furthermore, as money pours into U.S. equities, more of it than ever is flowing into companies that are near financial distress.
Please see below:
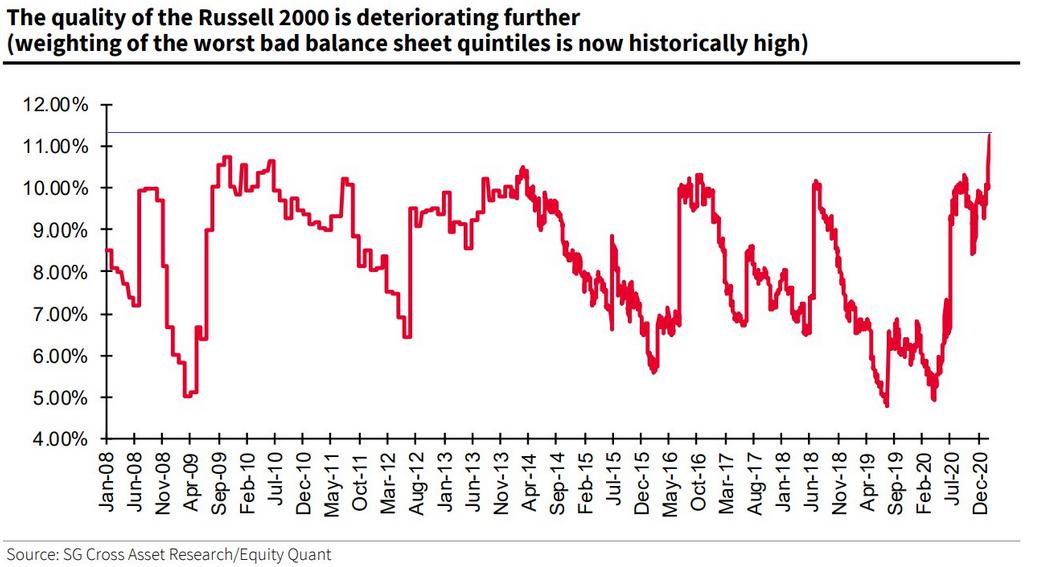
To explain, the red line above represents companies with ‘weak balance sheets.’ Essentially, these are companies with high leverage ratios that rely on a strong economic backdrop to service their debt. At the end of 2019, these companies made up roughly 6% of the Russell 2000 index. Today, that figure has nearly doubled to an all-time high of more than 11%.
And why is this happening?
Because as the U.S. Federal Reserve floods the system with excess liquidity, investors chase the riskiest assets that they can find. Case in point: special purpose acquisition companies (SPACs) raked in nearly $26 billion in January. And if you analyze the right side of the chart below, you can see that the amount of money flowing into speculative investments is occurring at an unprecedented rate.
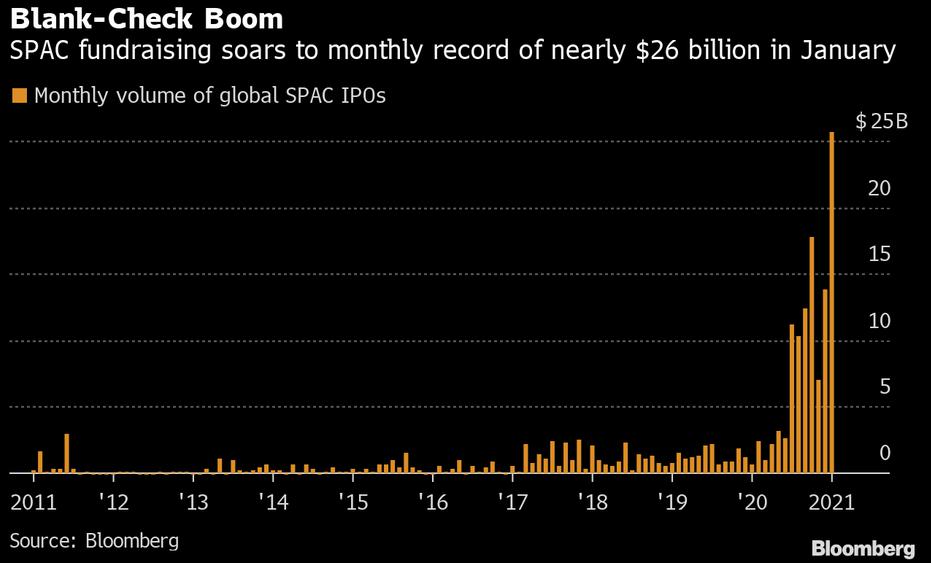
To explain the term, SPACs are, essentially, publicly traded hedge funds. SPAC managers raise money and IPO the company with the intent of purchasing private and/or public companies. However, the key word is ‘intent.’ Investors that purchase SPAC shares have no idea when an acquisition will be made. Furthermore, because the majority of SPAC managers target early-stage technology companies, investors end up buying unprofitable companies at multiples akin to the dot-com bubble.
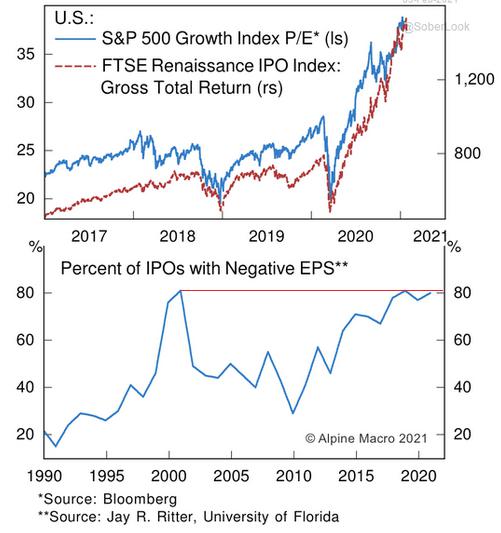
As evidence, the FTSE Renaissance Global IPO Index – which tracks the activity and performance of the global IPO market – has made a vertical move higher since 2020. In addition, the percentage of companies with negative earnings hitting the IPO market is only slightly below the 2000 high (~80%).
Please see below:
If that wasn’t enough, companies with EV/sales ratios that exceed 20 are exchanging hands like its 1999.
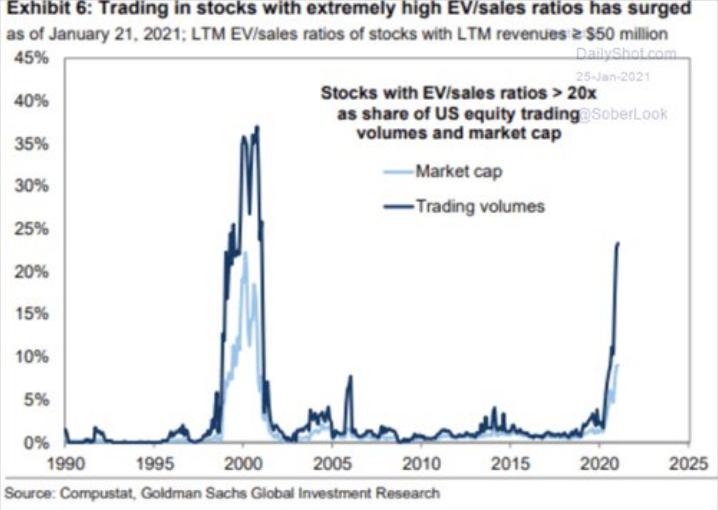
To explain, EV is an acronym for enterprise value. And enterprise value is the sum of a company’s equity and debt, less its non-operating assets. The key point is: the higher the EV/sales ratio, the higher a company’s valuation is relative to its revenue. Or to put it more bluntly, the more expensive the stock. In addition, companies with the highest EV/sales ratios tend to reside in the technology sector. And as you can see from the dark blue line above, today’s investors are trading these stocks just like their predecessors did before the 2000 bubble burst.
As a symptom of all of the above, the NASDAQ 100 is now outperforming the S&P 500 by a record margin. Eclipsing the previous high set in 2000, today’s technology companies are trading in uncharted territory.
Please see below:
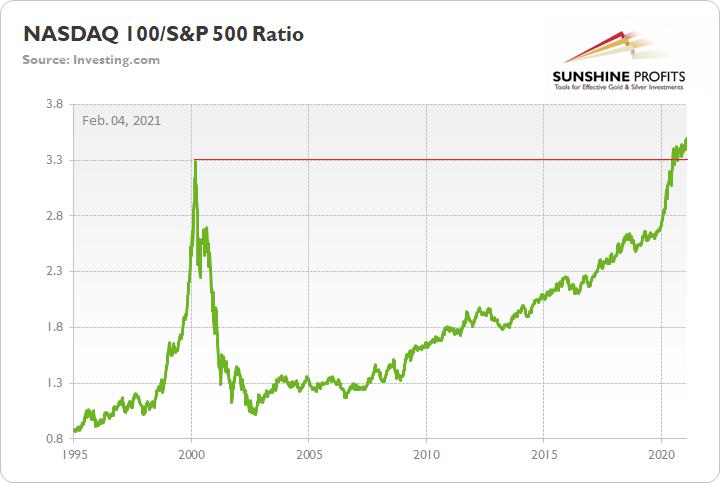
To explain, the green line above depicts the performance of the NASDAQ 100 relative to the S&P 500. When the green line is rising, it means that the NASDAQ 100 is outperforming. Conversely, when the green line is falling, it means that the S&P 500 is outperforming. As you can see, 2000 is no longer the main course.
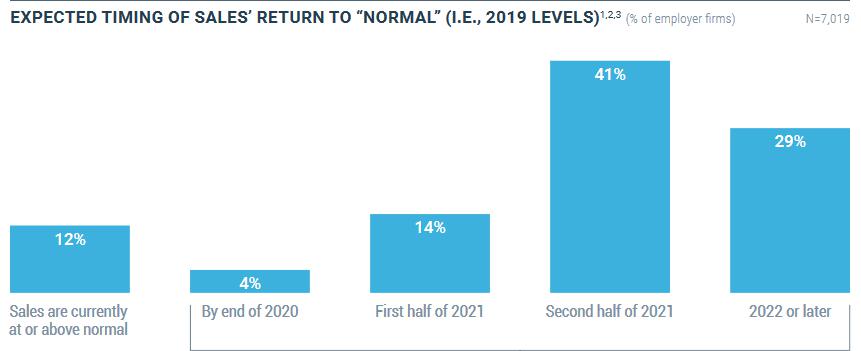
But while equities make their vertical move higher, the U.S. economy remains stuck in reverse. On Feb. 3, the U.S. Federal Reserve released its annual Small Business Credit Survey. And nearly one year after the pandemic struck, 88% of U.S. small businesses said that their revenue is still tracking below pre-pandemic levels.
Please see below:
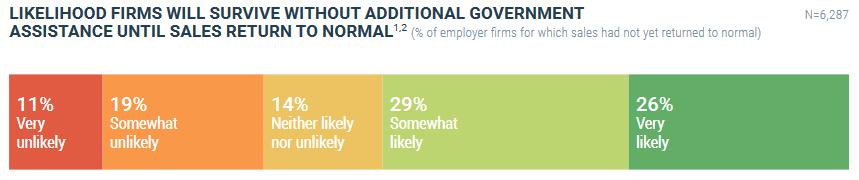
Even more telling, 30% of the nearly 10,000 respondents said that without additional government aid, it’s somewhat-to-very unlikely that their companies will survive.
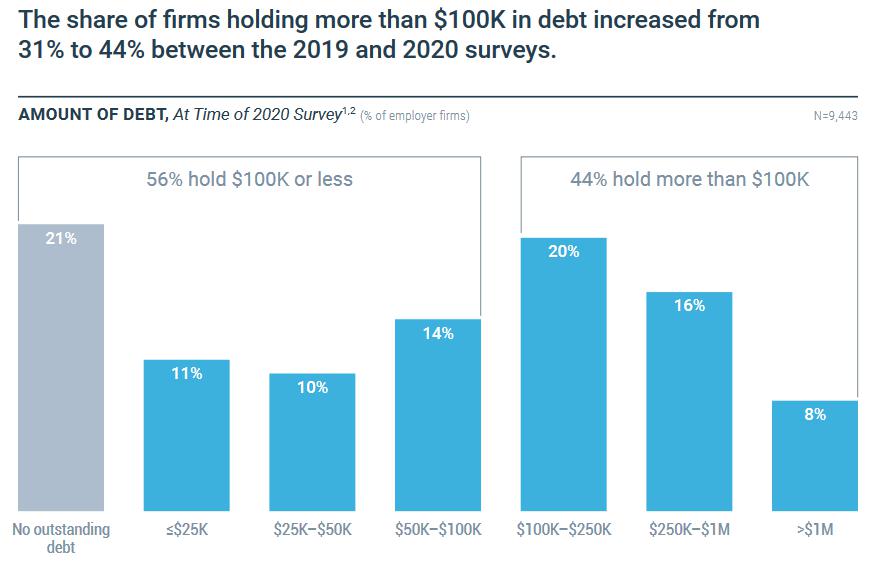
In addition, these struggling businesses have taken on more debt than ever. Relative to 2019, the percentage of companies with more than $100,000 in financial liabilities has increased by more than one-third.
But saving the best for last: what stood out the most?
Well, at the beginning of the report, the text reads:
“The SBCS is an annual survey of firms with fewer than 500 employees. These types of firms represent 99.7% of all employer establishments in the United States.”
That number again: 99.7%.
The bottom line? While pundits claim that the U.S. economy is experiencing a robust recovery, soldiers on the ground are telling a different story.
Circling back to the PMs, how could all of the above affect the metals?
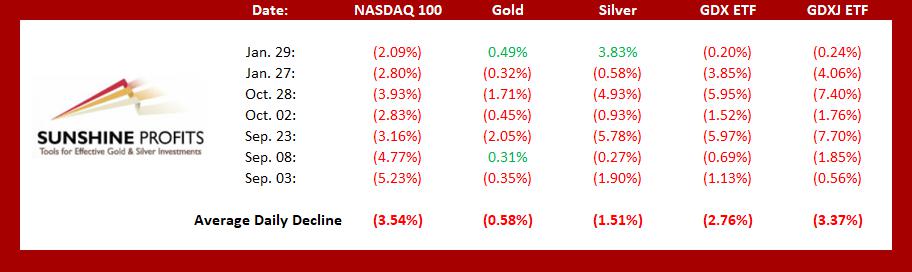
Well, like I mentioned at the beginning, a drawdown of U.S equities will likely cascade across the precious metals’ market. If you exclude the one-day divergence on Jan. 29 (due to silver’s short squeeze mania), a more than 2% drawdown of the NASDAQ 100 significantly impacts the PMs.
Please see below:
Summary
The U.S. equities continue to walk a tightrope, but the line is becoming narrower by the day. And when you combine excessive speculation that exceeds the dot-com bubble with economic fundamentals that mirror the 2008 financial crisis, valuations are completely divorced from reality. As a result, a reversion to the mean could drag down the precious metals. However, after the dust settles (perhaps several weeks - months from today), the PMs will likely continue their long-term uptrend.
Gold had a good post-Covid-panic run-up in 2020, but since it failed to hold its breakout above its 2011 high, despite ultra-dovish monetary and fiscal policies tells us that forecasting gold’s rally without a bigger decline first is likely to be misleading. Silver is likely to slide as well. The times when gold is continuously trading well above the 2011 highs will come, but they are unlikely to be seen without being preceded by a sharp drop first.
Thank you for reading our free analysis today. Please note that it is just a small fraction of today’s all-encompassing Gold & Silver Trading Alert. The latter includes multiple premium details such as the outline of our trading strategy as gold moves lower.
If you’d like to read those premium details, we have good news for you. As soon as you sign up for our free gold newsletter, you’ll get a free 7-day no-obligation trial access to our premium Gold & Silver Trading Alerts. It’s really free – sign up today.
Przemyslaw Radomski, CFA
Founder, Editor-in-chief
Sunshine Profits - Effective Investments through Diligence and Care
* * * * *
All essays, research and information found above represent analyses and opinions of Przemyslaw Radomski, CFA and Sunshine Profits' associates only. As such, it may prove wrong and be subject to change without notice. Opinions and analyses are based on data available to authors of respective essays at the time of writing. Although the information provided above is based on careful research and sources that are deemed to be accurate, Przemyslaw Radomski, CFA and his associates do not guarantee the accuracy or thoroughness of the data or information reported. The opinions published above are neither an offer nor a recommendation to purchase or sell any securities. Mr. Radomski is not a Registered Securities Advisor. By reading Przemyslaw Radomski's, CFA reports you fully agree that he will not be held responsible or liable for any decisions you make regarding any information provided in these reports. Investing, trading and speculation in any financial markets may involve high risk of loss. Przemyslaw Radomski, CFA, Sunshine Profits' employees and affiliates as well as members of their families may have a short or long position in any securities, including those mentioned in any of the reports or essays, and may make additional purchases and/or sales of those securities without notice.
********
 Przemyslaw Radomski, CFA, is the founder, owner and the main editor of SunshineProfits.com. You can reach Przemyslaw at: http://www.sunshineprofits.com/help/contact-us/.


