Gold Price Forecasts


Mr. Gold-market has finally and clearly spoken. We are back above the 200-MA (US$1,309.79) for the first time within a year.
Arguments for lower prices:
- Overall Gold still is in a downtrend. US$1,525.00 remains the line in the sand. Gold will need much more time to break through this heavy resistance. Only a move above US$1,430.00 will indicate that the trend has indeed changed.
- Gold Monthly Chart: MACD sell signal active since November 2011 (this is extremely powerful and needs to change before one can call the bottom, but MACD histogram is already turning higher from oversold levels.
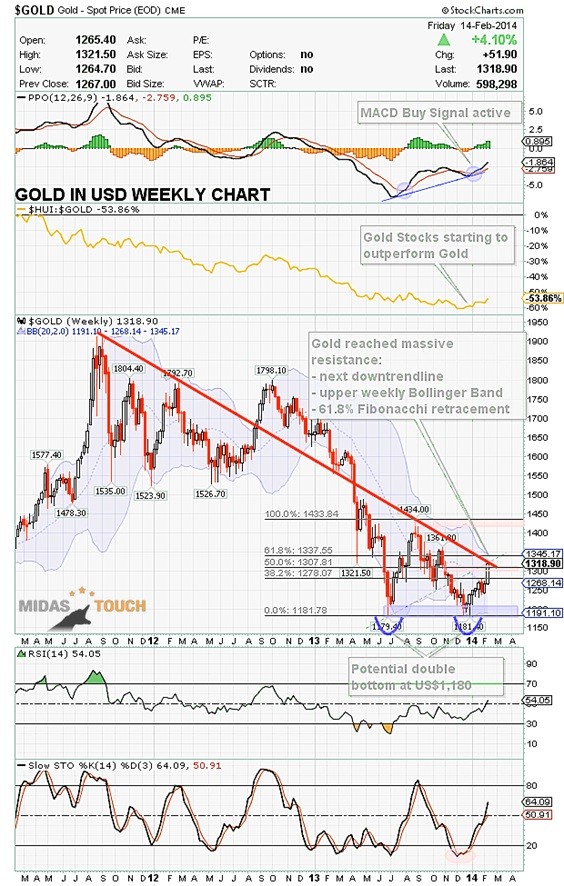
- Gold Weekly Chart: Last Friday Gold moved into massive resistance territory. Multi-month downtrend line around US$1,320.00, the falling upper weekly Bollinger Band (US$1,347.17) and the 61.8% Fibonacchi retracement from the summer highs (US$1,434.00) and December lows (US$1,180.00) at US$1,337.55.
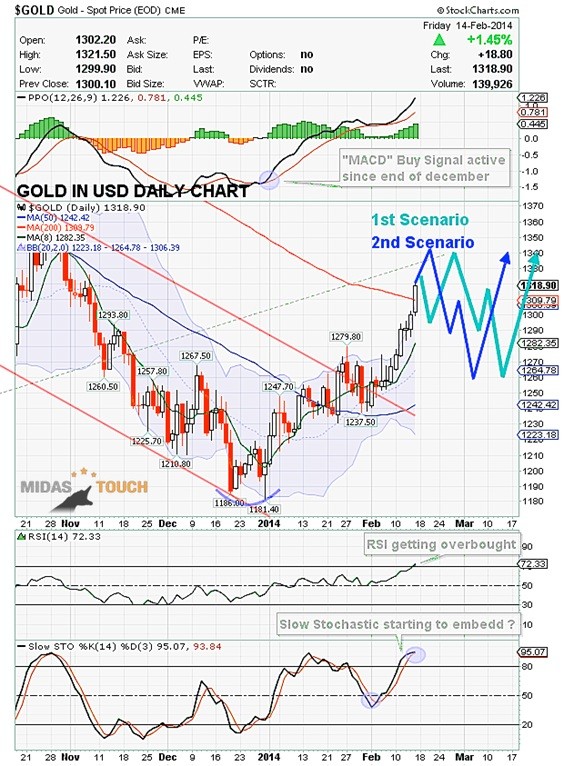
- Gold Daily Chart: Gold has been moving higher for the last 8 of 9 trading sessions. This is strong warning signal that the market is getting short-term overbought. As well Gold is currently for the fourth day above its daily Bollinger Band (US$1,306.39).
- Gold CoT-Data: Long-term still at low levels but Commercials have been increasing their short position and continue to sell into strength.
- Seasonality: From mid of February until end of march the seasonal window typically is negative for Gold and Silver.
Sentiment: Many new bullish analysis appeared during the last couple of days. Kitco is reporting >77% Bulls in its weekly Gold Survey. Sentiment data for HUI Gold Bugs is at 90% and shows excessive optimism.
Arguments for higher prices:
- Since end of December Gold has managed to establish a clear series of higher highs and higher lows. The critical support level around US$1,180.00 is far away and the price action has a different character than the last three fast advances which turned out to be just a short squeeze/bear-market rally.
- Gold Weekly Chart: Gold saw the biggest gains within one week since last july. MACD buy signal is still active and supporting the bulls. RSI and Slow Stochastic Oscillator still have plenty of room to move higher.
- Gold Daily Chart: As expected Gold went up to the 200-MA (US$1,309.79). The technical picture has strongly improved. MACD still with a buy signal while the Slow Stochastic is about to embed (both signal lines above 80 for more than 3 days..).
- Silver finally exploded higher on Friday (+5.34%) jumping over its 200 MA (US$21.13).
- Gold/Silver Ratio: Now at 61.39 breaking through the uptrend-line and it´s 200MA. This is very positive as Silver starts to outperform Gold.
- Junior Gold Miners (GDXJ) continue to outperform Gold and are leading the whole sector now.
- The US-Presidential Cycle is supportive for the next 12 months as the mid-term election years are traditionally good for Gold and Silver.
Long-term Fundamental: While the public is celebrating 100 years of Federal Reserve System, the balance sheet of the FED is now above US$4 trillion. The level has climbed by more than US$1 trillion over the course of 2013 as the central bank continued its bond-buying program launched in September 2012.
Conclusion:
- Mr. Gold-market has finally and clearly spoken. We are back above the 200-MA (US$1,309.79) for the first time within a year. Although this is very positive for the mid-term outlook, I am getting very very cautious for the short-term now. I think the next move will be to the downside testing the 50-MA (US$1,242.42) for support. After this correction Gold should continue to move higher and reach US$1,430.00 until May or June.
- Short-term Gold is at massive resistance and I believe the following two scenarios have the highest probability for the next couple of weeks:
- 1st Scenario: Similar to Platinum in January Gold will bounce back from the 200-MA for the next 1-3 trading sessions down to around US$1,295.00. From here a final move up to around US$1,335 to US$1,345 is likely. But the falling weekly Bollinger Band will stop any further price advance and professionals will sell Gold short above US$1,335. With a typical ABC-correction pattern Gold should then not only move below US$1,300 but correct at least 50% or more likely 61.8% of the rally from the December lows targeting US$1,245 to US$1,265 for a bottom. In this zone we can also find the rising 50-MA (US$1,242.42) which now is strong support but needs to be tested before Gold really can move above the 200-MA (US$1,309.79).
- 2nd Scenario: Gold opens with a final spike on Monday morning pushing prices directly towards US$1,340. After 8 days of rising prices this advance is not sustainable and Gold will directly start an ABC correction down to US$1,245 to US$1,265 as described in scenario 1.
- I am a long-term gold bull and believe we will see much higher prices but my short-term outlook for the next 2 - 6 weeks is that we will have a consolidation and correction in the precious metal sector.
- Traders should tighten up their stops and take at least some money off the table. Experienced ones could even short sell Gold above US$1,335 for a swing trade targeting US$1,275 with a stop-loss at US$1,350.
Investors with a long-term perspective have to wait for the coming correction to buy physical Gold below US$1,285 and Silver below US$20,80. This is not the time to buy but to be patient.
Long-term:
- Nothing has changed
- Precious Metals bull market continues and is moving step by step closer to the final parabolic phase (could start in summer 2014 & last for 2-3 years or maybe later)
- Price target DowJones/Gold Ratio ca. 1:1
- Price target Gold/Silver Ratio ca. 10:1
Fundamentally, Gold should soon start the final 3rd phase of this long term bull market. 1st stage saw the miners closing their hedge books 2cd stage continuously presented us news about institutions and central banks buying or repatriating gold. The evolving 3rd and finally parabolic stage will end in the distribution to small inexperienced new investors who will be subject to blind greed and frenzied panic.
********
Germany
E-Mail: [email protected]
Website: www.goldnewsletter.de
 Florian Grummes (born 1975 in Munich) has been studying and trading the Gold market since 2003. In 2008 he started publishing a bi-weekly extensive gold analysis containing technical chart analysis as well as fundamental and sentiment analysis. Parallel to his trading business he is also a very creative & successful composer, songwriter and music producer. You can reach Florian at: [email protected].


