Gold Price Garnering Power As The Buck Goes Sour


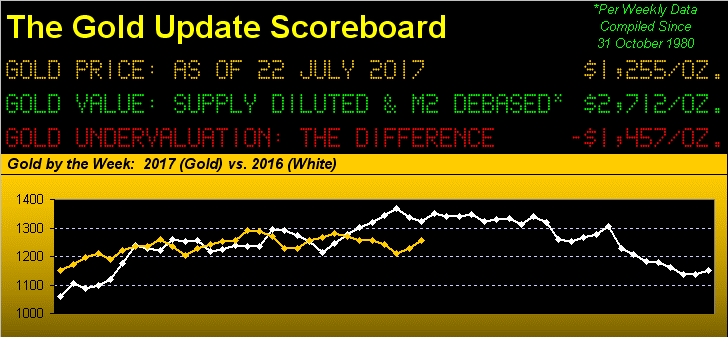
For those of you fond of the fortnight, gold just finished its fourteenth of the year, with its third-best bi-weekly gain (+3.6%) of 2017; and this most recent week's gain (+2.2%) ranks fourth of the 28 year-to-date, price settling yesterday (Friday) at 1255 ... albeit that still lags where 'twas at this point a year ago (1322) as we above show. If only one could get excited about it all.
That said, whilst we are feeling a bit bulled-up on gold getting a grip rather than going over the cliff, we nevertheless are maintaining temperance given the age old adage that change is an illusion whereas price is the truth. And truth be told, gold's having moved back into its 1240-1280 box is anything but exciting. Were it a film, 'twould be entitled "A Return To Annoyance."
"But mmb, what if price just keeps powering up through here this time?"
Squire, whilst gold has seemingly abandoned any notion of taking advantage of that which has historically sent its price higher (i.e. currency debasement), one of the more popular drivers -- that of a diving dollar -- may this time serve to wrest gold up from its bounds of the 1240-1280 box as defined by the purple lines across the weekly bars that we next see. Note therein that price by rising is defying the parabolic trend (currently Short) for that study's third consecutive series; should such will out, we'll look back to see gold likely having powered up across 1300:

Further, let's actually take a look at the dollar: strictly by the technical read, its key is to hold 93, as denoted by the yellow line at right in this 30-year view of the Index. Should that level fail, the three red lines then come into support consideration, at which point one would expect gold to clearly be in power-up mode, especially should the Buck bust the 90 barrier:
'Course, putting aside the foibles of the six similarly faux-based currencies from which the Dollar Index is calculated, what StateSide fundamentally serves to weaken the Greenback is quantitative easing. Notwithstanding that "the economy's great" -- which 'tisn't -- one indeed wonders if the Dollar has had its eye on the faltering Economic Barometer, itself having declined in eight of the past ten weeks. Here 'tis:
Certainly if there's one thing which had been repetitively reliable millennium-to-date, (as you've oft seen in our chart of gold versus the increase in the US money supply), is the yellow metal's best days coming during a quantitative easing phase. Barring the above Baro turning back up right quick, we think the Federal Reserve Bank is done with its FedFunds up run, let alone making an attempt to later this year unwind its balance sheet. Its Open Market Committee's next policy statement is due this Wednesday (26 July, sans press conference). All that, in turn, is keeping the stock market carefree: "Whoopie!" Bob Shiller's price/earnings ratio for the S&P 500 is now confirmed above 30x; our "live" version is presently 35.6x; yet vastly undervalued remain one's gold bricks.
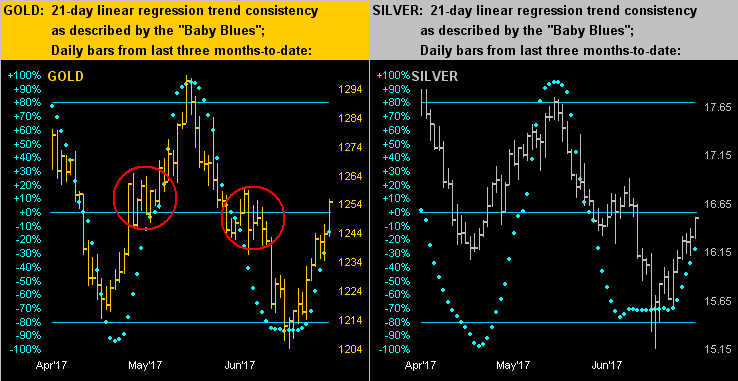
And to be sure, gold's upward cruise is nicely supported by its "Baby Blues". As noted a week ago: "Should the reliability of the dots' sweeping moves in recent months continue to play out, we'll see gold make a run well back into its 1240-1280 box to that clustering area you see 'round 1250." Didn't take long, eh? Of some concern below are the two red-encircled areas of that demonstrated price-clustering, which technically may have gold apply the brakes for a bit through here, although the dots are on the rise. So here on the left are gold's daily bars for the past three months-to-date, the baby blue dots of 21-day linear regression trend consistency nicely breaking out to the upside, as on the right we've the same for silver:
Moreover, from our "Fun With Numbers Dept.", were gold to maintain weekly rises of 2.2%, price would pass through 2000 right about on Christmas Day of this year. Happy Everything! Whilst that's not our forecast, don't think like rises haven't happened. For gold to reach a price of 2000 by year's end from its present 1255 level would require an increase of 59% over the 112 trading days remaining in 2017. Obviously that percentage increase happened with ease over the same number of days from 1979 into 1980; but far less acknowledged, it also happened in 1983 as well as in 2006. Just a wee nugget to keep tucked away up there in your fertile crevices.
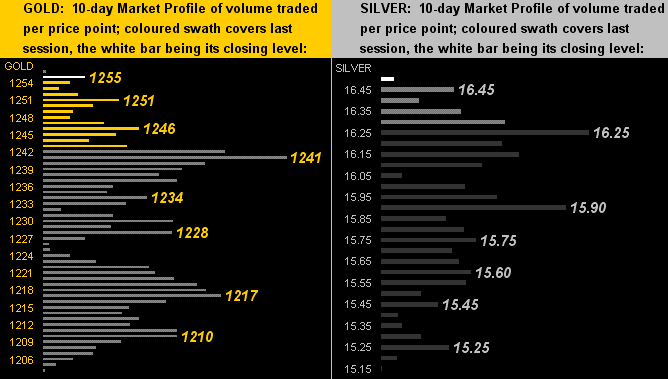
Nearer-term per these 10-day Market Profiles, both gold (left) and silver (right) are essentially parked at the top of their respective trading stacks. The key supporter for gold stands stark at 1241, whilst for more volatile Sister Silver, we'll point to her two dominant shelves at 16.25 and 15.90:
So with Gold's being on the up move of late, let's again see where it sits in its big-picture stack:
The Gold Stack
Gold's Value per Dollar Debasement, (from our opening "Scoreboard"): 2712
Gold’s All-Time High: 1923 (06 September 2011)
The Gateway to 2000: 1900+
Gold’s All-Time Closing High: 1900 (22 August 2011)
The Final Frontier: 1800-1900
The Northern Front: 1750-1800
On Maneuvers: 1579-1750
The Floor: 1466-1579
Le Sous-sol: Sub-1466
Base Camp: 1377
2017's High: 1298 (06 June)
The Weekly Parabolic Price to flip Long: 1291
Neverland: The Whiny 1290s
The 300-Day Moving Average: 1259 and falling
10-Session directional range: up to 1256 (from 1204) = +52 points or +4%
Trading Resistance: none, per the 10-Day Market Profile
Gold Currently: 1255, (expected daily trading range ["EDTR"]: 12 points)
Trading Support: numerous, notably 1241 / 1228 / 1217 / 1210
"The Box": 1240-1280
10-Session “volume-weighted” average price magnet: 1229
2017's Low: 1147 (03 January)
On into FedWeek we go, perhaps the larger story therein being next Friday's (28 July) release of the first peek at Q2 Gross Domestic Product. The consensus is for annualized growth of 2.8%. Given the state of the Econ Baro, we'll believe it (or not) when we see it. Gold's goal for now is to stay firm coming into the afore-encircled price-clustering area of the 1250s.

Mark Mead Baillie has had an extensive business career beginning in banking and financial services for two years with Banque Nationale de Paris to corporate research for three years at Barclays Bank and then for six years as an analyst and corporate lender with Société Générale.
For the last 22 years he has expanded his financial expertise by creating his own financial services company, de Meadville International, which comprehensively follows his BEGOS complex of markets (Bond/Euro/Gold/Oil/S&P) and the trading of the futures therein. He is recognized within the financial community of demonstrating creative technical skills that surpass industry standards toward making highly informed market assessments and his work is featured in Merrill Lynch Wealth Management client presentations. He has adapted such skills into becoming the popular author each week of the prolific “The Gold Update” and is known in the financial website community as “mmb” and “deMeadville”.
Mr. Baillie holds a BS in Business from the University of Southern California and an MBA in Finance from Golden Gate University.


