Gold Price Update


The last Gold Market update almost a month ago called the intermediate top within a day, as you may recall, and the subsequent Gold and US Dollar Interim update called the rally in the dollar the day before it started. Having seen a significant reaction back by gold, the question now is “Has it run its course?” The short answer to that is yes, although calling a bottom here is complicated by the fact that gold’s COTs have not eased as much on the reaction as we might have expected, and the dollar Hedgers’ chart is still flat out bullish for the dollar. What this means is that we may need to see some bottoming action by gold, even if it soon breaks out of its rather steep short-term downtrend, and another possibility that we will examine is that the dollar and gold rally in tandem, a rare circumstance that could be occasioned by an extreme development such as an attack on North Korea, although if this happens the peoples of Seoul and Tokyo will doubtless have more important things to think about than the price of gold.
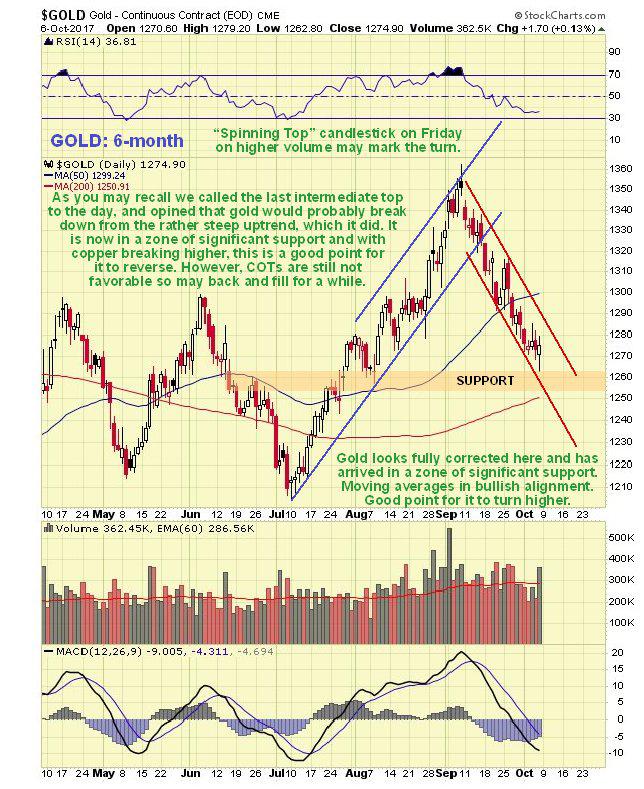
On gold’s latest 6-month chart we can see how the reaction of recent weeks has retraced about 50% of the prior rally, as tensions with N Korea have temporarily eased. This reaction has more than fully corrected the overbought condition resulting from the rally, and has brought gold back into a zone of significant support just above its rising 200-day moving average, and with moving averages in bullish alignment, conditions generally favor a reversal and rally. The “spinning top” candlestick that occurred on Friday on increased volume may mark the turn, although the candlesticks that occurred on the charts for silver and silver proxies look like more convincing reversals.
An important factor having a bearing on the outlook for the Precious Metals was the nice reversal in copper on Thursday after a significant reaction, with it gaining nearly 3%...
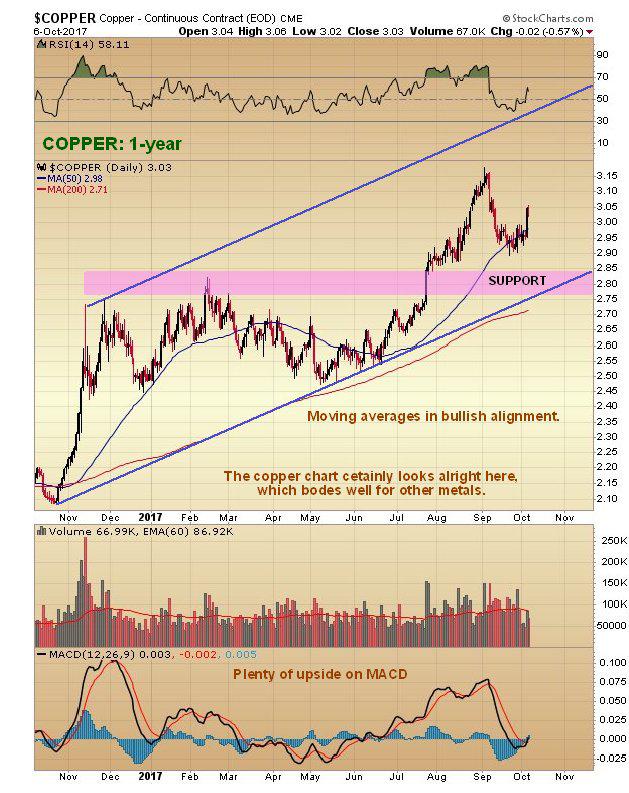
Given that copper tends to lead other metals as it did on the last rally, this could well be followed by gold and silver reversing to the upside after their reaction back to support, despite the dollar looking like it has further to rally. Another positive factor for gold and silver is that there was a full moon late last week and the Precious Metals often reverse on either the new or full moon, although astrologically silver is ruled by the moon and gold by the sun, which may explain why the Incas, famous for their gold, worshipped the sun – which makes a lot more sense than many of the other things that get worshipped. If you think that is wacky, try this for size – eclipses are thought by many astrologers to be a baleful omen, and you may recall that on August 21st a total eclipse of the sun slashed right across the US from coast to coast. Soon after, the country was clobbered by a succession of natural disasters, in addition to Donald Trump’s Tweetstorms, with 3 massively destructive hurricanes impacting Texas, then Florida, and lastly Puerto Rico. Coincidence? – I think not.
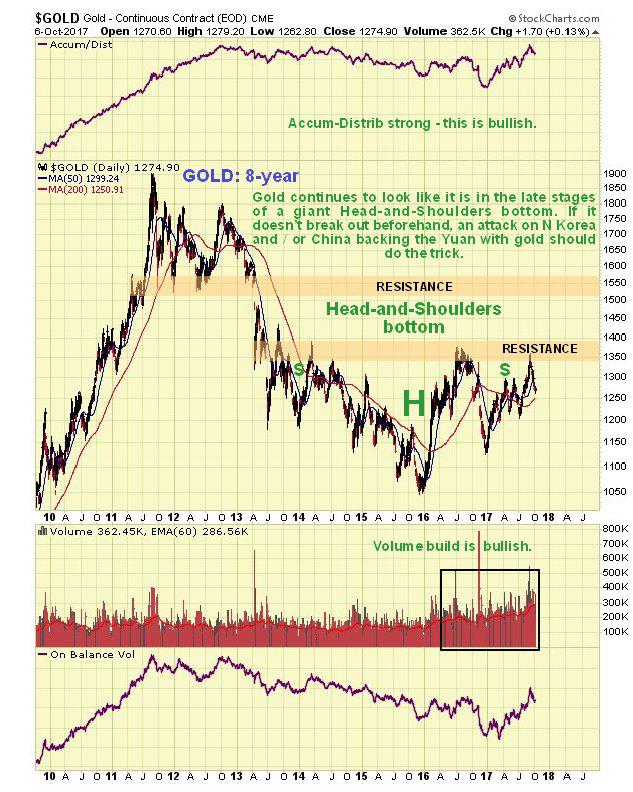
On gold’s 8-year chart it continues to look like it is in the late stages of a giant Head-and-Shoulders bottom pattern. The buildup in volume over past 20 months certainly looks positive, especially over the past several months, all the more so because it has driven volume indicators higher, notably the Accum-Distrib line, which is not far off making new highs – exceeding its level at the 2011 peak. Once gold breaks above the resistance level approaching $1400 it will be on its way, although it will then have to contend another important band of resistance in the $1510 - $1560 range.
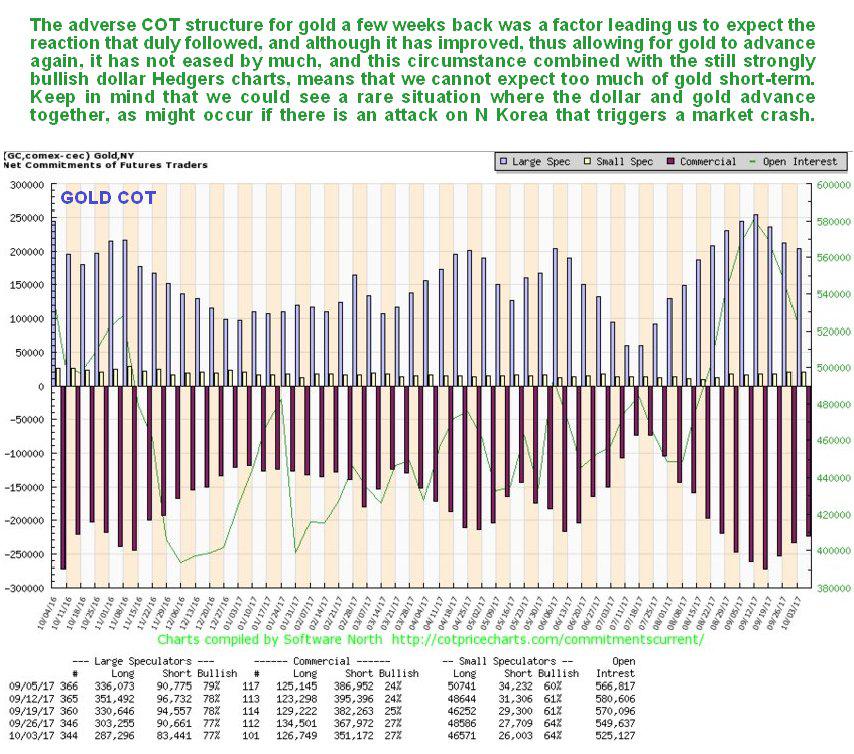
The latest COT chart for gold shows that, while positions have certainly eased on the reaction of recent weeks, they have not eased by as much as one would expect, which sounds a cautionary note and suggests that a rally now may be stunted, and followed by more basing action before a larger uptrend can gain traction. This accords with what we are seeing on the dollar charts, especially the latest dollar Hedgers chart.
Click on chart to popup a larger, clearer version.
The Market Vectors Gold Miners, GDX, which functions as a gold stocks index, is marking out a giant Head-and-Shoulders bottom that roughly parallels the one completing in gold itself. The fact that the price is still well below the strong resistance at the top of this reversal pattern means that prices for many gold (and silver) stocks are still very favorable. The volume pattern during the build out of this base pattern is very bullish, with big volume on the rise out of the low (Head) of the pattern, tailing off steadily as the Right Shoulder has formed.

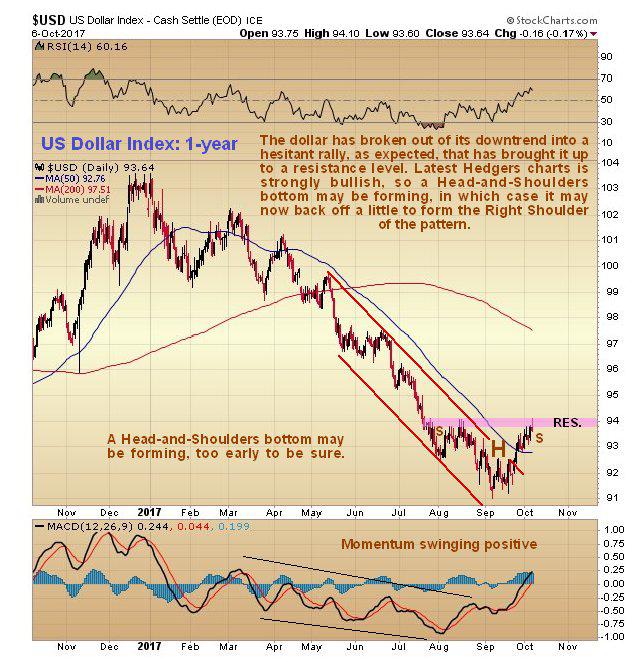
The dollar looks like it has put in an intermediate bottom. On the 1-year dollar index chart shown below, we can see that it has broken out of its downtrend by a significant margin and looks like it may be marking out a Head-and-Shoulders bottom, although it is still too early to be sure. If it is then we will see a shallow dip to mark out the Right Shoulder of the pattern before it then turns higher.
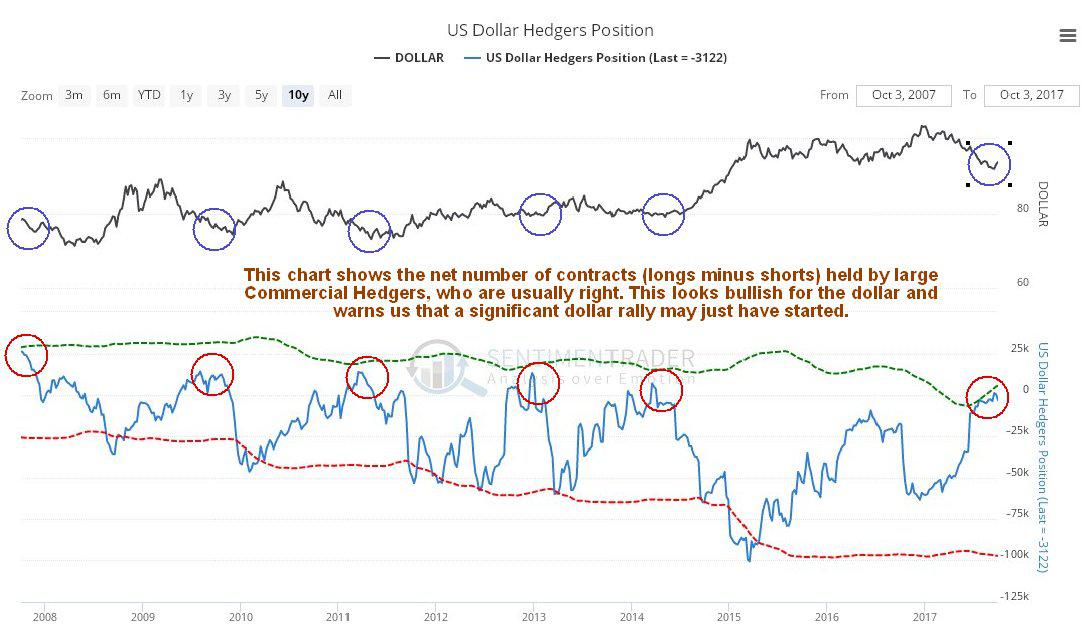
The latest dollar Hedgers chart certainly looks bullish, with the large Commercial Hedgers having cleared out their short positions…
Click on chart to popup a larger, clearer version.
Chart courtesy of www.sentimentrader.com
Although we cannot reconcile this positive dollar outlook for the medium-term (long-term outlook remains bearish) with a positive outlook for the Precious Metals sector, there are times when the dollar and gold and silver rally together. This could happen for example if some drastic action is taken with respect to North Korea.
*******

Clive P. Maund’s interest in markets started when, as an aimless youth searching for direction in his mid-20’s, he inherited some money. Unfortunately it was not enough to live a utopian lifestyle as a playboy or retire very young. Therefore on the advice of his brother, he bought a load of British Petroleum stock, which promptly went up 20% in the space of a few weeks. Clive sold them at the top…which really fired his imagination. The prospect of being able to buy securities and sell them later at a higher price, and make money for doing little or no work was most attractive – and so the quest began, especially as he had been further stoked up by watching from the sidelines with a mixture of fascination and envy as fortunes were made in the roaring gold and silver bull market of the late 70’s.
Clive furthered his education in Technical Analysis or charting by ordering various good books from the US and by applying what he learned at work on an everyday basis. He also obtained the UK Society of Technical Analysts’ Diploma.
The years following 2005 saw the boom phase of the Gold and Silver bull market, until they peaked in late 2011. While there is ongoing debate about whether that was the final high, it is not believed to be because of the continuing global debasement of fiat currency. The bear market since 2011 is viewed as being very similar to the 2-year reaction in the mid-70’s, which was preceded by a powerful advance and was followed by a gigantic parabolic price ramp. Moreover, Precious Metals should come back into their own when the various asset bubbles elsewhere burst, which looks set to happen anytime soon.
Visit Clive at his website: CliveMaund.com


