Gold Price Update


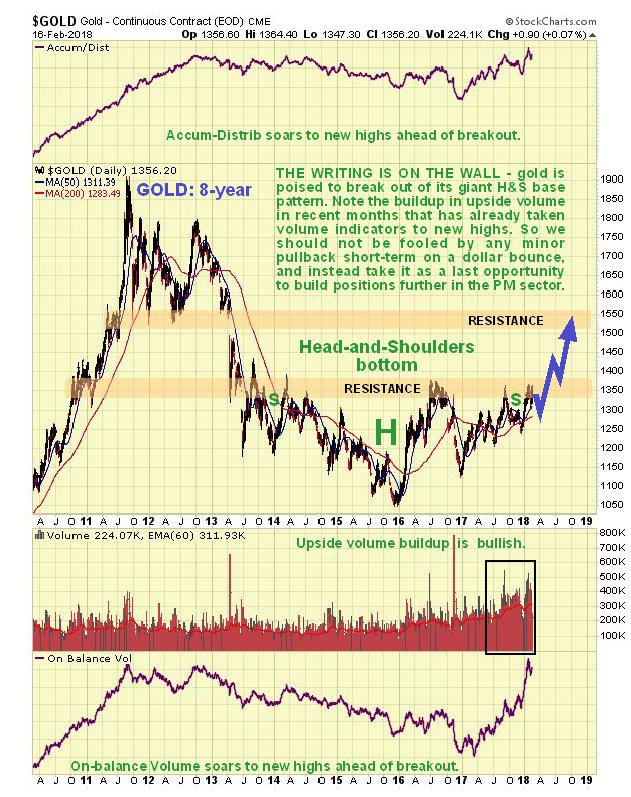
Gold continues to prepare to break out of its giant Head-and-Shoulders bottom pattern. As we can see on its 8-year chart below, this base pattern has been developing for getting on for 5-years now, so it has major implications. Upside volume has been building for a long time, driving volume indicators higher, a sign that a breakout and new bullmarket is simply a matter of time, and not much at that now.
There has been much grumbling and muttering within the gold community about how “The Cartel” and the Comex etc are holding the gold price in restraint by means of naked short selling, and hitting the market with supply when trading is thin during public holidays and overnight and so on, but the fact of the matter is that the reason why the Precious Metals sector has taken a back seat for years now is that there have been hotter games in town, like Biotech, Bitcoin, Cannabis, the FANGS, Tech generally etc and endless quantities of cheap money to bid them up into the stratosphere. So that is where the action has been. However, to everything its season and all that is coming to an end now, and the recent plunge in the stockmarket was a “shot across the bows” to all who would heed it, indicating that a new bearmarket is starting, but don’t go telling that to the buy the dip crowd.
Gold does well and has its best bullmarkets when stocks generally are in a bearmarket, so don’t get fooled by PM stocks falling with the stockmarket at this time – that won’t last. Thus it is worth observing that gold has outperformed stocks during the period since the stockmarket plunge started – it is back where it was before the plunge, which is more than can be said for stocks.
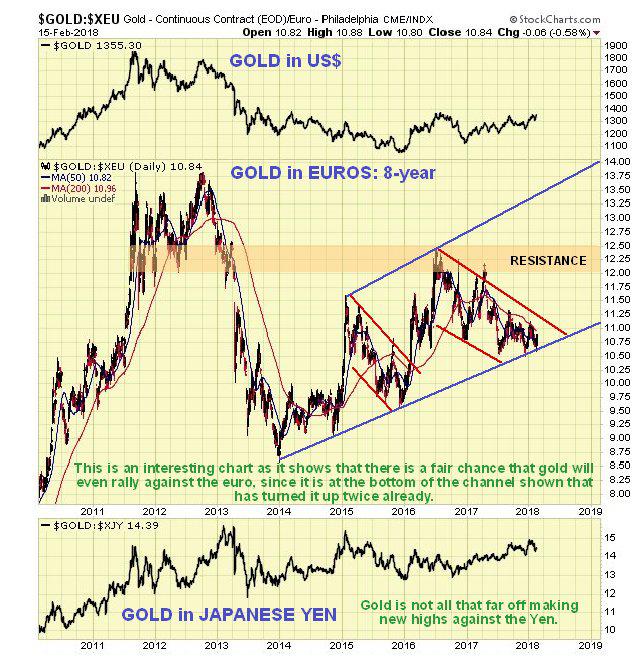
Before looking at gold’s shorter term 6-month chart, it is worth taking a quick detour to see how it is getting on against some other currencies. Over the past year or so the dollar has dropped quite hard, with the prime beneficiary of this drop being the euro, which has risen substantially. Therefore we should not be surprised to see that gold has dropped against the euro during this same period. What is interesting to observe on the 8-year chart for gold in euros, however, is that it has arrived at the lower boundary of a large uptrend that has turned the price back up on 2 occasions already. This suggests that gold is going to rise even in euros, and since the dollar is expected to continue to drop, regardless of any brief countertrend rally, it means that it should rise faster still against the dollar, which of course is what we would expect to see once it breaks out of its Head-and-Shoulders bottom shown on its normal dollar chart. Before leaving this chart observe how gold is not all that far off making new highs against the yen, shown at the bottom of the chart.
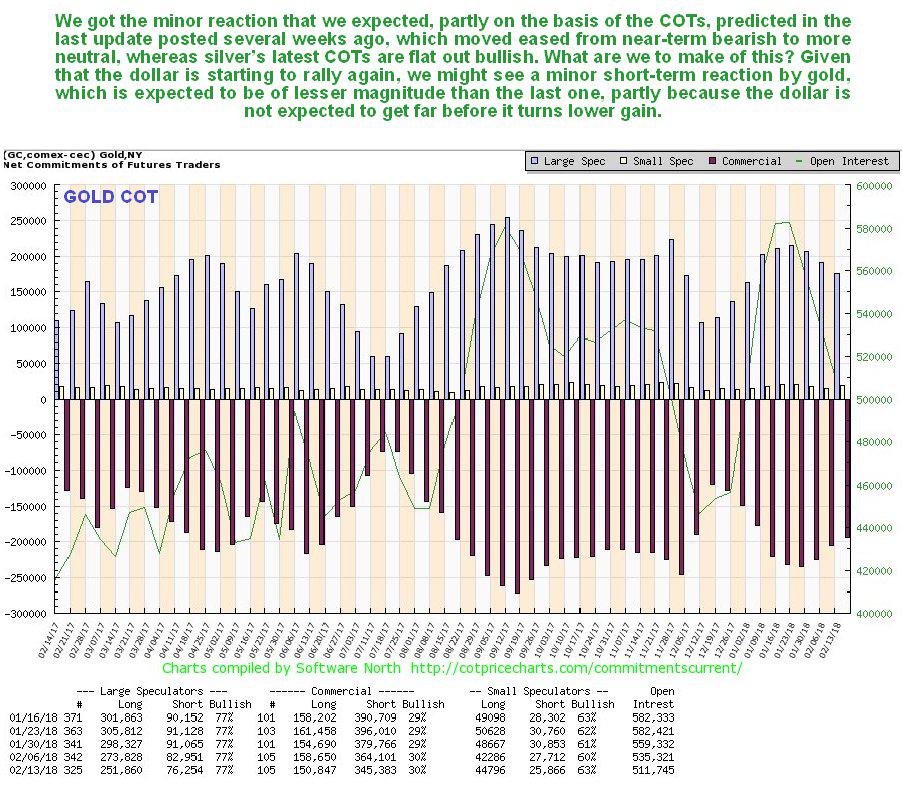
Turning now to the latest COT chart, the Large Specs high long positions are a factor that prompted us to look for a reaction in gold in the last update several weeks back. Readings have eased significantly since, although they are in middling ground and still far from levels that could be described as emphatically bullish. Such is not the case with silver, however – silver’s latest COT is flat out bullish, so it could be that silver rallies and gold comes along for the ride, and gold’s COTs do show that there is sufficient leeway for this to happen.
Click on chart to popup a larger clearer version.
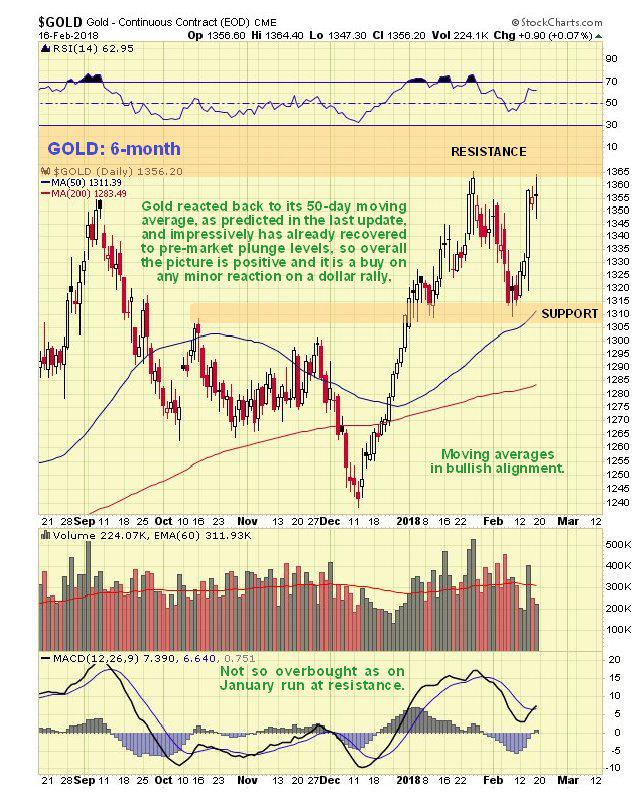
The latest 6-month chart shows that gold reacted just as we expected it to in the last update, back close to its rising 50-day moving average, and the good news is that, as we can see, it has already gotten back to where it was before the stockmarket plunge, an early sign of the outperformance to come. Right now, with the dollar having turned up from support again on Friday and looking set to stage a modest rally, gold looks set to react back again from the resistance shown towards the support once more, which should throw up another opportunity to accumulate the better PM stocks, and they have already started to drop back again.
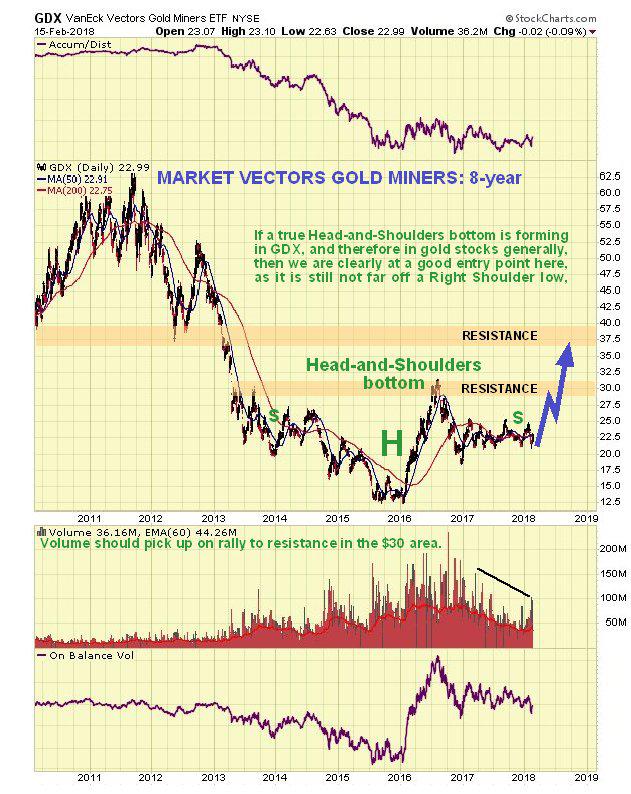
Now we’ll look at several charts for PM stocks, as represented by the proxy Market Vectors Gold Miners ETF, GDX. Starting with the 8-year chart we see that it has marked out a giant Head-and-Shoulders bottom pattern that parallels the one in gold itself, but there is one big difference – GDX is much closer to the Right Shoulder low of its H&S bottom than gold itself is, so you could say that gold stocks are better value here, as even a rise by GDX just to the neckline of its H&S bottom would result in big gains in many stocks.
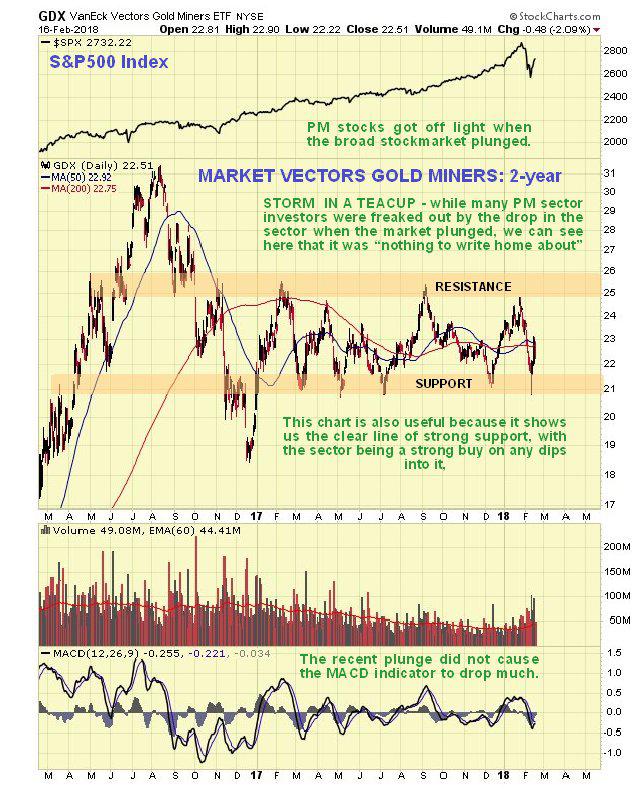
The 2-year chart for GDX puts the recent drop in sympathy with the broad market into perspective. On this chart it looks like “a storm in a teacup” – it didn’t breach the strong support shown and downside momentum, as shown by the MACD, was not all that great.
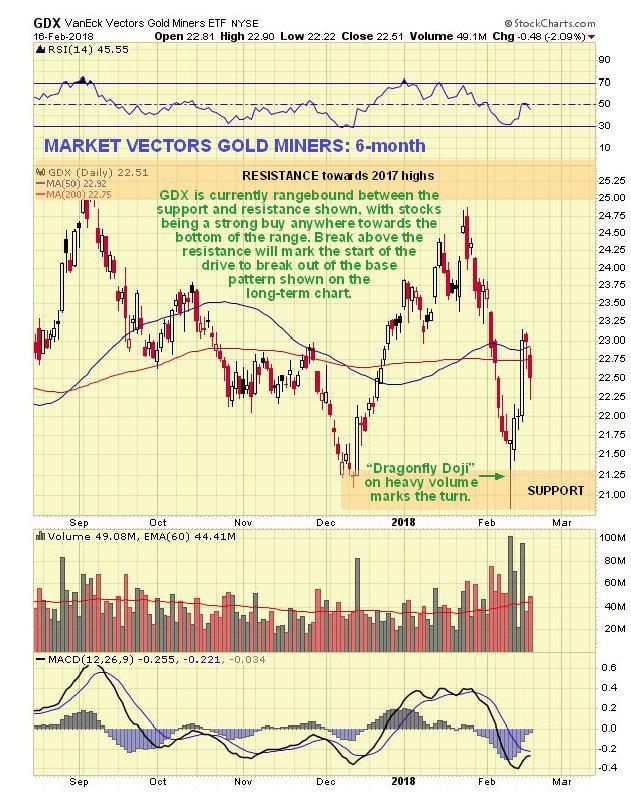
The 6-month chart for GDX shows that investors were freaked out by the plunge in the broad stockmarket and dumped PM stocks over the side too. This is normal in the early panic stages of broad market bearmarkets, but eases as the bearmarket becomes more established and the PM sector is increasingly seen as a safe haven. As with mainstream stocks, GDX recouped about 50% of its losses during the plunge, which we correctly anticipated in THE MAGNIFICENT DRAGONFLY DOJI REVERSAL CANDLE IN GDX , and is now turning lower again due to the dollar starting higher.
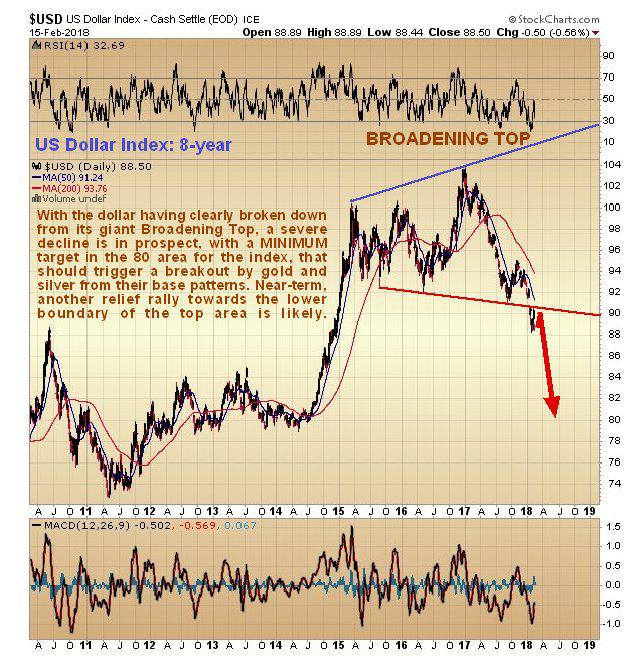
Now we move on to consider the dollar, as ever crucial in our calculations. As pointed out in the last update, the dollar has broken down from a giant Broadening Top, an ominous development, as we can see on the latest 8-year chart for the dollar index below, and now looks set to drop to a minimum target in the 80 area, notwithstanding any short-term rallies to near the breakdown point at the lower boundary of the top pattern.
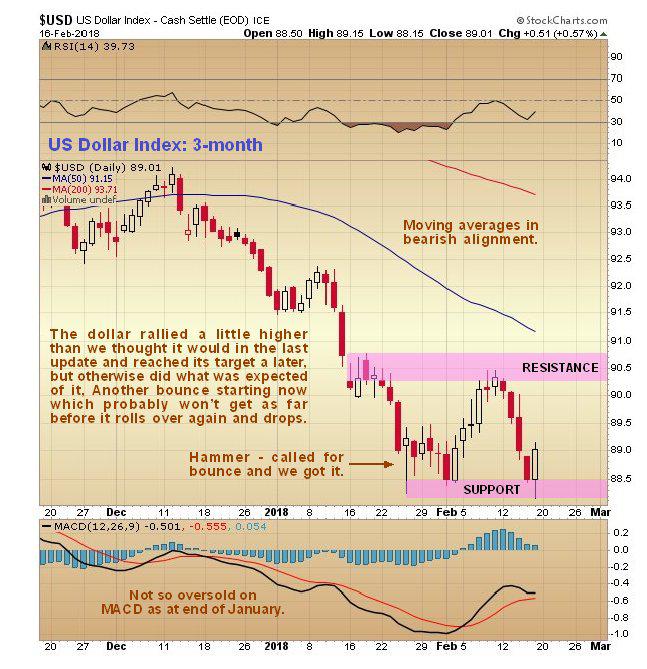
Finally on the 3-month chart for the dollar index we can see how it rallied back to the lower boundary of the Broadening Top, as predicted in the last update, although it got a little higher than we expected and got there a little later, and then backed off again, also as predicted. Now, with a bullish candle forming on Friday, it looks like it is going to have another go at it, although this time the rally is expected to fail at a lower level. This would correspond with the minor reaction now expected across the PM sector that will throw up another buying opportunity.
On clivemaund.com we have had a string of outstanding successes in recent months that have made – or saved – subscribers a lot of money. These include calling the top in Bitcoin 3 days before it in BITCOIN TOTAL WIPEOUT ALERT and a day after it in The Bitcoin Market would like to thank The Greatest Fool, calling the top for the cannabis sector ramp late last year in CANNABIS SECTOR URGENT UPDATE within 3 days of it, defining the sell signal on the broad US stockmarket meltup 1 day before it was triggered in BROAD US STOCKMARKET MELTUP update – HOW TO PINPOINT THE FINAL TOP, calling the plunge in the oil price in OIL SET TO TANK, calling the bottom of the recent stockmarket plunge in MOM & POP GET LYNCHED, calling the recent bottom in the PM sector in THE MAGNIFICENT DRAGONFLY DOJI REVERSAL CANDLE IN GDX and a number of associated perfect or near perfectly timed trades such as PotNetwork Holdings bought on 28th December right before it took off like a rocket, Freedom Leaf just before a really big upleg, the USO Put trades recommended in OIL SET TO TANK and sold less than a week later for 5 and 6 times gain as set out in Review of our MASSIVELY PROFITABLE USO PUT TRADE and many less dramatic but profitable trades.
Many new subscribers have made back the cost of a subscription within a few weeks and often in a matter of days. So if you are not already a subscriber you should “put your best foot forward” and become one – don’t do it to help me out – you owe it to yourself.
*********

Clive P. Maund’s interest in markets started when, as an aimless youth searching for direction in his mid-20’s, he inherited some money. Unfortunately it was not enough to live a utopian lifestyle as a playboy or retire very young. Therefore on the advice of his brother, he bought a load of British Petroleum stock, which promptly went up 20% in the space of a few weeks. Clive sold them at the top…which really fired his imagination. The prospect of being able to buy securities and sell them later at a higher price, and make money for doing little or no work was most attractive – and so the quest began, especially as he had been further stoked up by watching from the sidelines with a mixture of fascination and envy as fortunes were made in the roaring gold and silver bull market of the late 70’s.
Clive furthered his education in Technical Analysis or charting by ordering various good books from the US and by applying what he learned at work on an everyday basis. He also obtained the UK Society of Technical Analysts’ Diploma.
The years following 2005 saw the boom phase of the Gold and Silver bull market, until they peaked in late 2011. While there is ongoing debate about whether that was the final high, it is not believed to be because of the continuing global debasement of fiat currency. The bear market since 2011 is viewed as being very similar to the 2-year reaction in the mid-70’s, which was preceded by a powerful advance and was followed by a gigantic parabolic price ramp. Moreover, Precious Metals should come back into their own when the various asset bubbles elsewhere burst, which looks set to happen anytime soon.
Visit Clive at his website: CliveMaund.com
More from Gold-Eagle


