Gold Price Update


Gold has not even been able to muster a rally on the Greek crisis, which is a bad sign, especially as the dollar looks like it is preparing to break out upside from a large consolidation pattern.
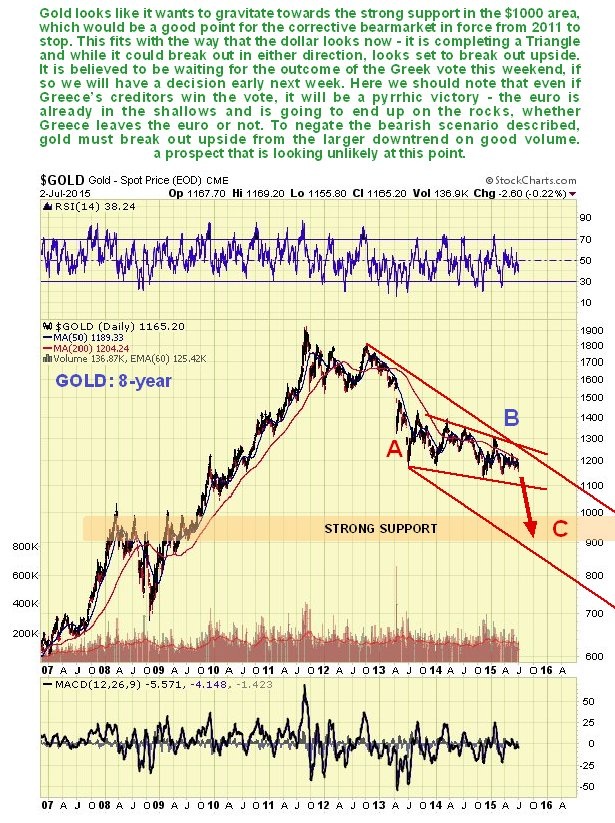
On its 8-year chart we can see that gold is still in the large down-sloping consolidation pattern that has been going on for 2 years now. Goldbugs like to think that this trading range is a pattern is a base pattern, and while it may be, this is viewed as wishful thinking. Instead it looks like the B-wave of a large A-B-C correction from gold’s highs in 2011. If it is, then the C-wave, which is suspected to be imminent, will take gold down at least to the strong support in the $1000 area, and probably lower towards the lower boundary of its large downtrend channel shown – if it gets there we are looking at $850 - $870. The good news is that this should mark the end of gold’s bear market, especially as a rising rate cycle is just over the horizon, and contrary to popular belief, gold thrives in a rising rate environment – anyone remember the late 70’s??
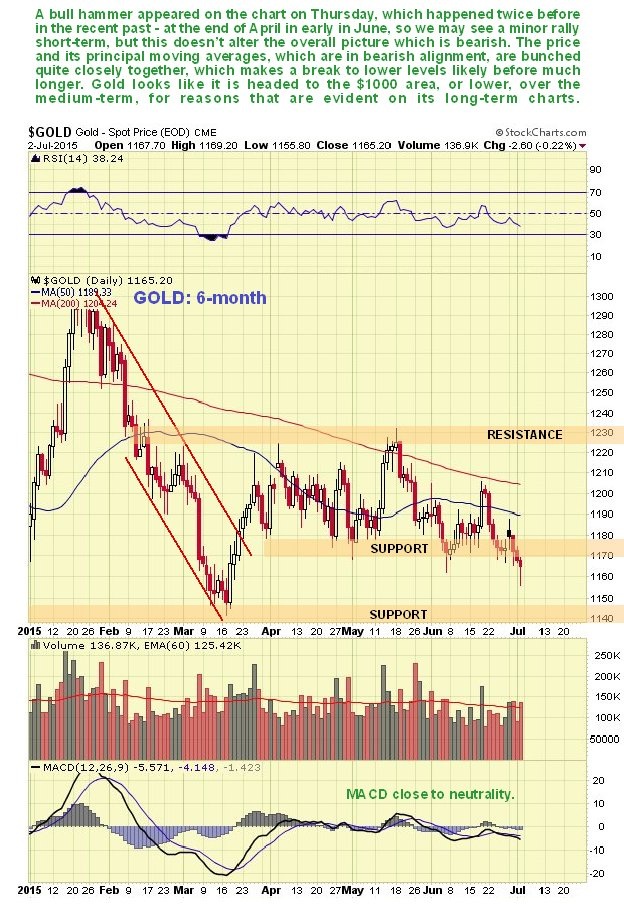
The 6-month chart, which is of limited use technically, shows us recent action in more detail. Action on this chart is generally bearish, although on the positive side, gold put in a bull hammer on Thursday, and the last two times it did that, at the end of April and early in June, a short-term rally followed. Overall though, this chart looks negative, especially as the price is quite closely bunched with its principal moving averages, which are in bearish alignment, suggesting that even if we see a minor short-term rally, a breakdown and quite steep decline is likely to follow.
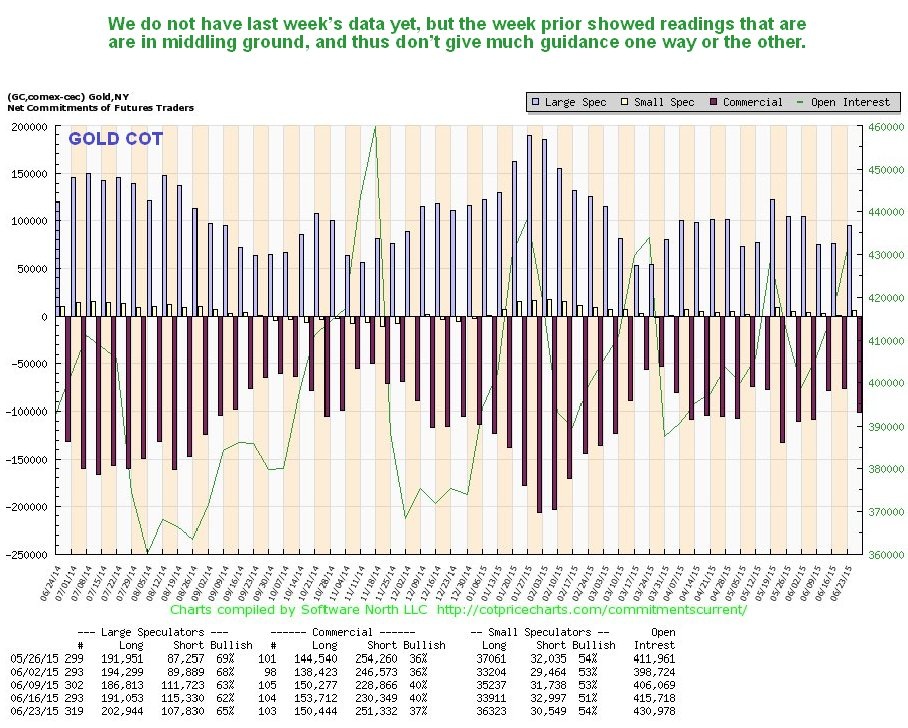
Gold’s latest COT is in middling ground and thus provides limited guidance. Note that this chart lacks last week’s update, probably because it has been delayed by Friday being a public holiday in the US. It will be updated after the latest data becomes available.
The Gold Hedger’s chart is in middling ground and doesn’t give us much of a clue about direction, one way or the other.
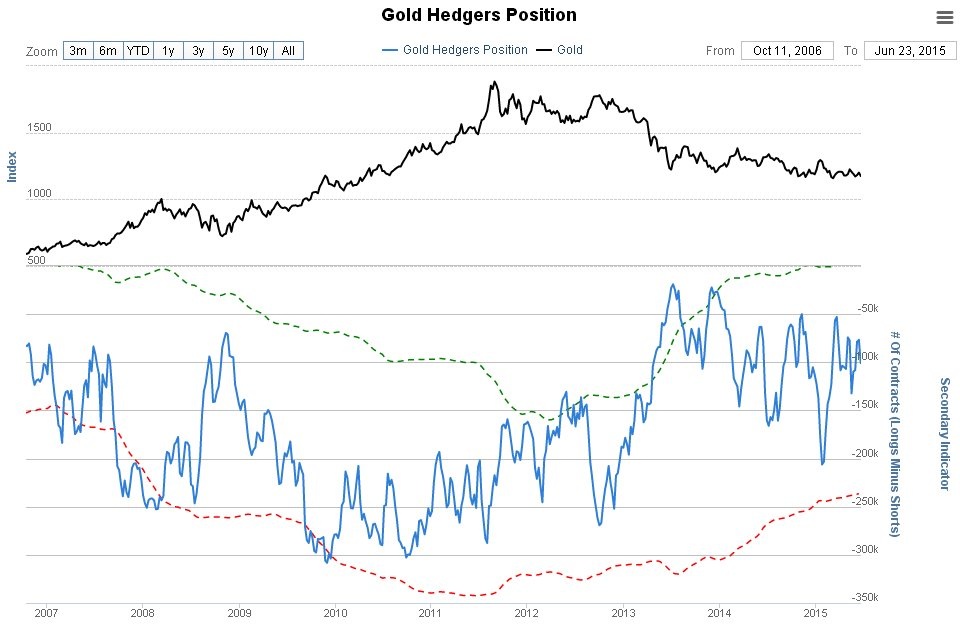
Chart courtesy of www.sentimentrader.com
The latest Gold Optix chart looks bullish. This won’t stop gold from dropping as it can get even more bullish on a drop, but what this and the Rydex Precious Metals Assets chart, which follows, do tell us is that we are probably not too far from a major bottom here
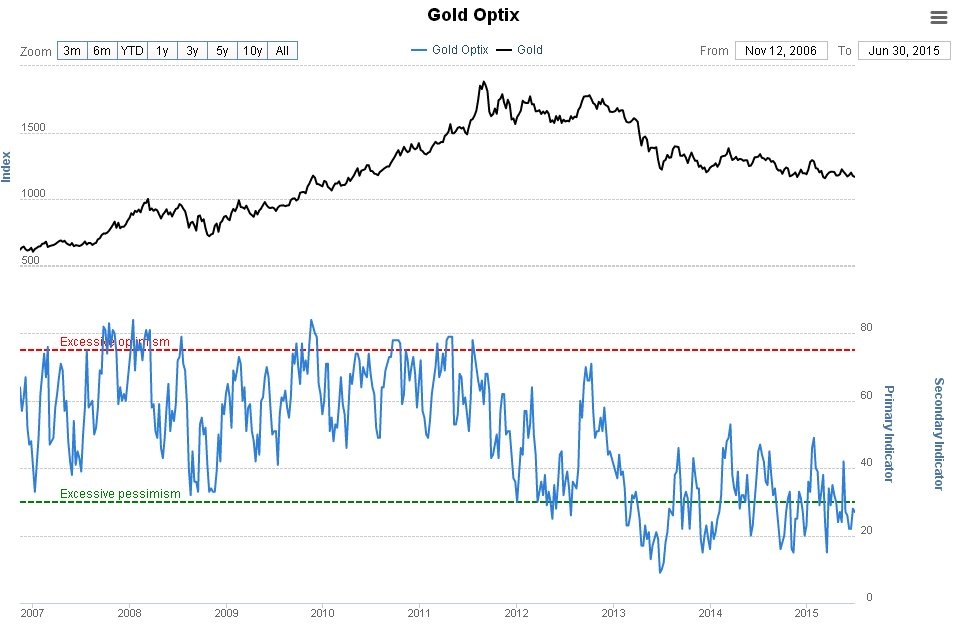
Chart courtesy of www.sentimentrader.com
The Rydex Precious Metals Assets chart certainly looks bullish and warns us not to get too bearish, even though we are expecting a drop over the medium-term, and also to keep a keep a close eye out either for convincing signs of a final bottom or evidence that a major new uptrend is starting, such as an upside breakout on strong volume from the major downtrend currently still in force.
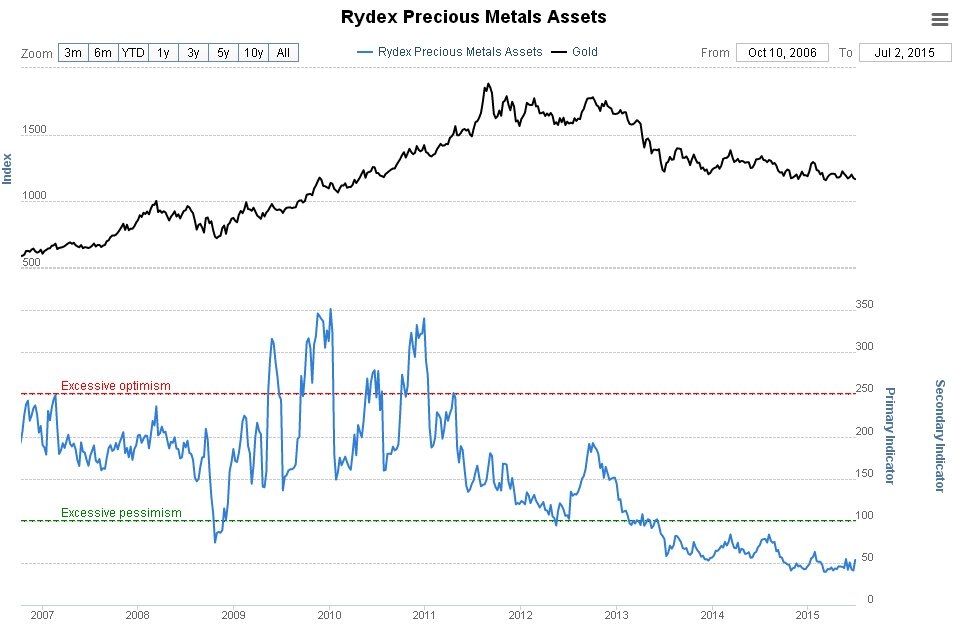
Chart courtesy of www.sentimentrader.com
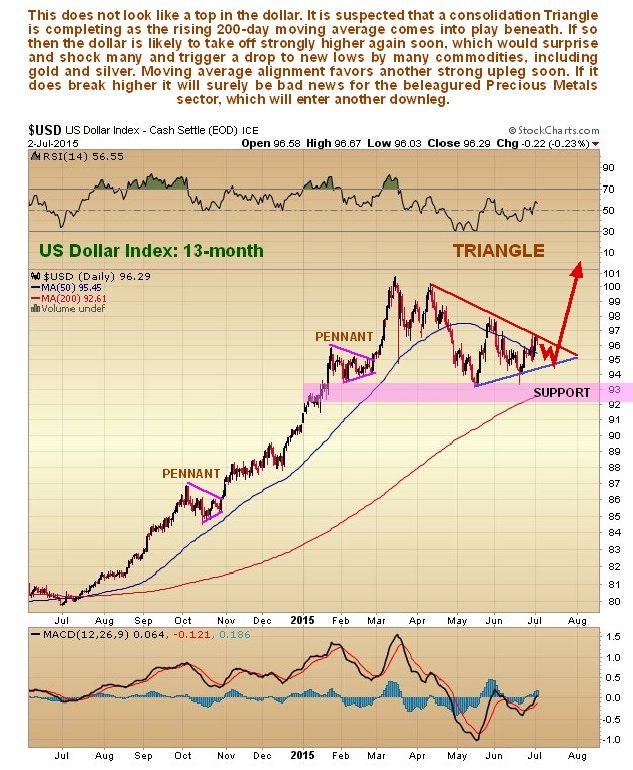
A big reason for expecting gold and silver to drop sharply to lower levels over the medium-term is the outlook for the dollar. The dollar is currently completing a Symmetrical Triangle pattern, which could be either a continuation pattern or a top. The point at which this Triangle has formed, some away above a still rising 200-day moving average, suggests that it is going to break out upside and embark on another major upleg, and it is not hard to see why, since the dollar index is comprised largely of the euro, and the euro is on the ropes, whichever way the Greek vote goes, after its countertrend relief rally of the past couple of months.
Conclusion
Gold and silver look like they are consolidating within their downtrends ahead of another sharp drop, which is expected to synchronize with another dollar up-leg. Over the longer-term, and contrary to general expectations, a mega bull market is expected to be ignited by a new cycle of rising rates as in the late 70’s, which will devastate the inflated bond and stock markets.
********
Courtesy of http://www.clivemaund.com

Clive P. Maund’s interest in markets started when, as an aimless youth searching for direction in his mid-20’s, he inherited some money. Unfortunately it was not enough to live a utopian lifestyle as a playboy or retire very young. Therefore on the advice of his brother, he bought a load of British Petroleum stock, which promptly went up 20% in the space of a few weeks. Clive sold them at the top…which really fired his imagination. The prospect of being able to buy securities and sell them later at a higher price, and make money for doing little or no work was most attractive – and so the quest began, especially as he had been further stoked up by watching from the sidelines with a mixture of fascination and envy as fortunes were made in the roaring gold and silver bull market of the late 70’s.
Clive furthered his education in Technical Analysis or charting by ordering various good books from the US and by applying what he learned at work on an everyday basis. He also obtained the UK Society of Technical Analysts’ Diploma.
The years following 2005 saw the boom phase of the Gold and Silver bull market, until they peaked in late 2011. While there is ongoing debate about whether that was the final high, it is not believed to be because of the continuing global debasement of fiat currency. The bear market since 2011 is viewed as being very similar to the 2-year reaction in the mid-70’s, which was preceded by a powerful advance and was followed by a gigantic parabolic price ramp. Moreover, Precious Metals should come back into their own when the various asset bubbles elsewhere burst, which looks set to happen anytime soon.
Visit Clive at his website: CliveMaund.com
More from Gold-Eagle


