For Gold Price We See Firmness; For Stocks…Oh My Goodness!


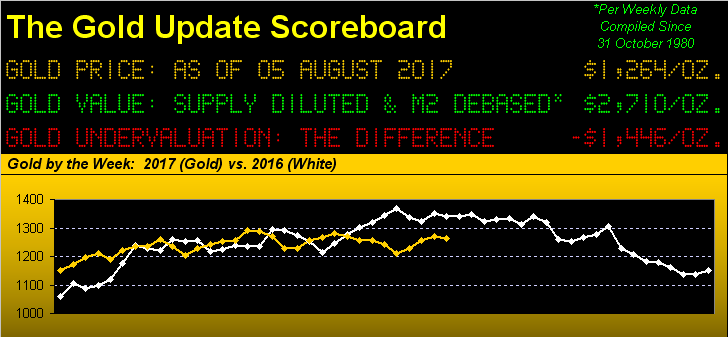
For the tenth time in the last four calendar years, gold again has settled out a week in the 1260s, in this case closing yesterday (Friday) at 1264. Not that betwixt and between price has been staid: since 24 January 2014 (gold then 1268), the yellow metal has settled a week as high as 1381 (14 March 2014) and as low as 1056 (27 November 2015). So should the adolescent in you from the rear of the Ford Country Squire station wagon be moaning "Are we there yet?" -- as justified as your cry may be -- no, we're nowhere near "there" yet.
"There" is of course relative: to the trader it being gold's push in trying to regain the 1300s toward opening the run back up to Base Camp 1377; or to the investor it being gold's making up for the debased currency toward attaining the 2710 level as shown in the above scoreboard.
Either way, in gold's attempt to rally for a fourth consecutive week, price did run afoul of this phrase from last week's missive: "barring the 'top of the box' 1280 sellers putting the kibosh on it all", the high since then indeed being 1280...
"Now what ya do, Mel, is when that number on the screen says 1280, ya push that red button that says 'Sell' on it, see? --- I do, Mort! Gosh, makin' money was never so easy!"...
Gatecrashers. Anyway let's face it: Gold's having lost just a mere 5 points for the week, (or even including the 6 points of newly-added December contract premium, having lost just 11 points), appears as only a muted give-back, indeed an exhibition of firmness given that Friday marked the Dollar's second strongest one-day gain of the year, (per the Index settling on ICE at 93.416 after having mid-week made a 14-month low at 92.390).
Moreover as we turn to gold's weekly bars, despite the manipulative efforts of Mort and Mel, this past week did produce both a "higher low" and "higher high", price having practically knocked on the red dot door of the now 1285 parabolic "flip-to-Long" level. Still, for the 16th of the 31 weeks year-to-date, gold finished within the purple bounds of its 1240-1280 box:

More broadly as we approach six years of daily gold settles since its All-Time Closing High, the price track from 2015 onward is at least reasonable, the overall tilt being higher from that year's label on this next graphic. And from the trough just past the 2016 label, gold has moved into a rather repetitive rhythmic choppiness, representative of equal pulling and pushing between the bears and the bulls. In this context, get gold above that green line of Base Camp 1377, and in looking back across the chart, there's really not that much technical resistance 'til the 1500s(!):
'Course, gold's weakest day of this past week was Friday, with selling kicking in over improvements in data reported by the U.S. Bureau of Labor Statistics, notably a drop in the Rate of Unemployment from 4.4% in June to 4.3% in July, with a like increase in the growth pace of Hourly Earnings from 0.2% to 0.3%. Also aiding the Economic Barometer as the week unfolded were pickups in June's Factory Orders and Pending Home Sales, plus the Trade Balance showing less of a deficit. Still, the Baro reflects July slowing in the Institute for Supply Management's readings in both manufacturing and services activities, as well as in the Chicago Purchasing Managers Index, plus flat Personal Income for June along with a setback in Construction Spending. Here's the picture:
And how 'bout that stock market, eh? As you good readers know, we pay "no never mind" to the Dow Jones Industrial Average (aka "That Index at which Our Parents Look"), nor to the NASDAQ (aka "That Index of Earningless Companies"). That said, in going back some two years, those two indices are in positive daily correlation 78% of the time: but in measuring the Dow vs. the NASDAQ 100, they've closed in opposite directions in 10 of the past 15 trading days.
Which is why for truth we stick with the S&P 500. And truth be told, with now 389 of the 500 companies having reported their Q2 earnings, just 198 of them -- which is only 51% -- have improved their year-over-year bottom lines: that is neutral, folks. And yet the S&P today at 2477 is 14% higher than 'twas on this date a year ago (2164). That, in turn, is why our "live" price/earnings ratio for the S&P is presently 42.8x ... the last time 'twas above 42x? 2001. (Oh My Goodness!)
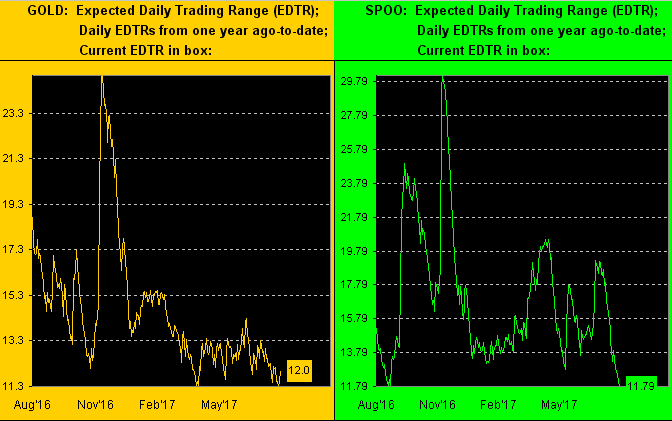
Moreover, as we hear day-after-day on the radio, the stock market is on fire. Really? If that is so, why is the expected daily trading range ("EDTR") of the S&P at its narrowest level in at least a year? As is that with gold, for which we see (below left) along with that for the S&P (below right), both EDTRs being down to around 12 points. And what is next month? September. (Oh My Goodness!)
All of which brings us to this next three-panel graphic of the last 21-trading days for gold (left), silver (center), and the S&P (right). Admittedly since we viewed this a week ago, the baby blue dots of linear regression trend consistency now are quite upside-stretched for the precious metals. Further, those for the S&P clearly are in downward curl. 'Course, the S&P has blown off every single negative technical reading it has encountered in the last two years, so "What, me worry?" (Oh My Goodness!)

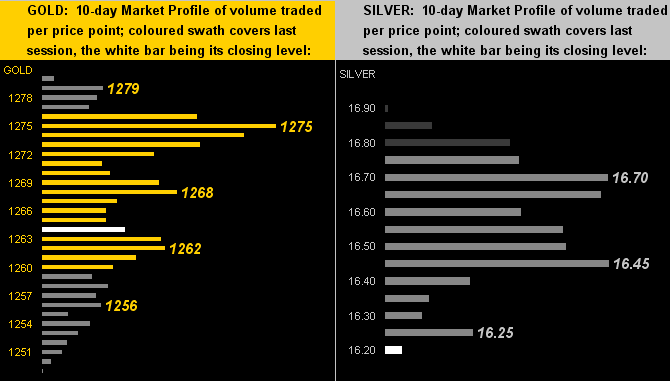
To the Market Profiles we go for gold (left) and silver (right). And after three consecutive weeks of price being parked at the top of the price stacks, we see Gold having retraced to the center of its Profile, whereas more volatile Sister Silver -- in tracing almost the entirety of her 10-day Profile on Friday alone -- hoovered all of her lower bars such as to now be parked in the basement:
Thus with an eye to gold staying firm, and in due course for the stock market to squirm, to the Gold Stack we go, price's current level therein we confirm:
The Gold Stack
Gold's Value per Dollar Debasement, (from our opening "Scoreboard"): 2710
Gold’s All-Time High: 1923 (06 September 2011)
The Gateway to 2000: 1900+
Gold’s All-Time Closing High: 1900 (22 August 2011)
The Final Frontier: 1800-1900
The Northern Front: 1750-1800
On Maneuvers: 1579-1750
The Floor: 1466-1579
Le Sous-sol: Sub-1466
Base Camp: 1377
2017's High: 1298 (06 June)
Neverland: The Whiny 1290s
The Weekly Parabolic Price to flip Long: 1285
10-Session directional range: up to 1280 (from 1249) = +31 points or +2%
10-Session “volume-weighted” average price magnet: 1268
Trading Resistance: 1268 / 1275 / 1279
Gold Currently: 1264, (expected daily trading range ["EDTR"]: 12 points)
The 300-Day Moving Average: 1259 and rising
Trading Support: numerous, notably 1252 / 1256
"The Box": 1240-1280
2017's Low: 1147 (03 January)
In closing it out for this week, we've this bit:
Did you happen to notice that Bits**t did a Bitsplit? 'Tis True. Bits**t's computer programming "miners" programmed a Bitfork into the underlying Bits**t "blockchain" such as to now travel along two Bitpaths, one being the original Bits**t and the new one dubbed Bits**t C**p. To quote the late great Peter Sellers in his role as Inspecteur Clouseau from the 1975 film "The Return of the Pink Panther": "A little bit of this and a little bit of that add up sometimes." Which by our math with respect to Bits**t and Bits**t C**p adds up to Bitzero. So again, do yourself a favour, luv: Hang onto your Gold!

Mark Mead Baillie has had an extensive business career beginning in banking and financial services for two years with Banque Nationale de Paris to corporate research for three years at Barclays Bank and then for six years as an analyst and corporate lender with Société Générale.
For the last 22 years he has expanded his financial expertise by creating his own financial services company, de Meadville International, which comprehensively follows his BEGOS complex of markets (Bond/Euro/Gold/Oil/S&P) and the trading of the futures therein. He is recognized within the financial community of demonstrating creative technical skills that surpass industry standards toward making highly informed market assessments and his work is featured in Merrill Lynch Wealth Management client presentations. He has adapted such skills into becoming the popular author each week of the prolific “The Gold Update” and is known in the financial website community as “mmb” and “deMeadville”.
Mr. Baillie holds a BS in Business from the University of Southern California and an MBA in Finance from Golden Gate University.
More from Gold-Eagle


