Gold Prices: The Big Picture


 Occasionally I receive emails from discouraged investors who are ready to give up on gold and silver. Some invested in 2010…and again in 2011 as prices were peaking, while others bought at much cheaper prices and are now wavering in their once unshakable stance. Fearing lower prices they contemplate selling for a loss or booking less than stellar gains. I understood their plight and wanted to release a quick article for others like them.
Gold prices were up 12-years consecutively, that is almost unheard of for any asset. Prices have corrected for 4-years and sentiment is tempering (necessary for further gains). Unfortunately, we may have several more months (7-15) before the bull market makes its triumphant return.
I explained months ago how the US Presidential election corresponds with significant bottoms in the gold and silver markets. Since the 1970’s gold prices have made these cycle lows approximately every 8-years, they often arrive 3-4 months before or 3-4 months after a US presidential election. The next election will be in November of 2016. I’ve structured a timing window that starts In July of 2016 and closes in March of 2017.
As always geopolitical events could circumvent or even speed up the 8-year cycle but for now I'm sticking to the historical trend. Yes, the timing window is broad but our system should reveal the 8-year cycle low upon its arrival or at least get us close. Until then traders should remain nimble and long-term investors are wise to make a shopping list.
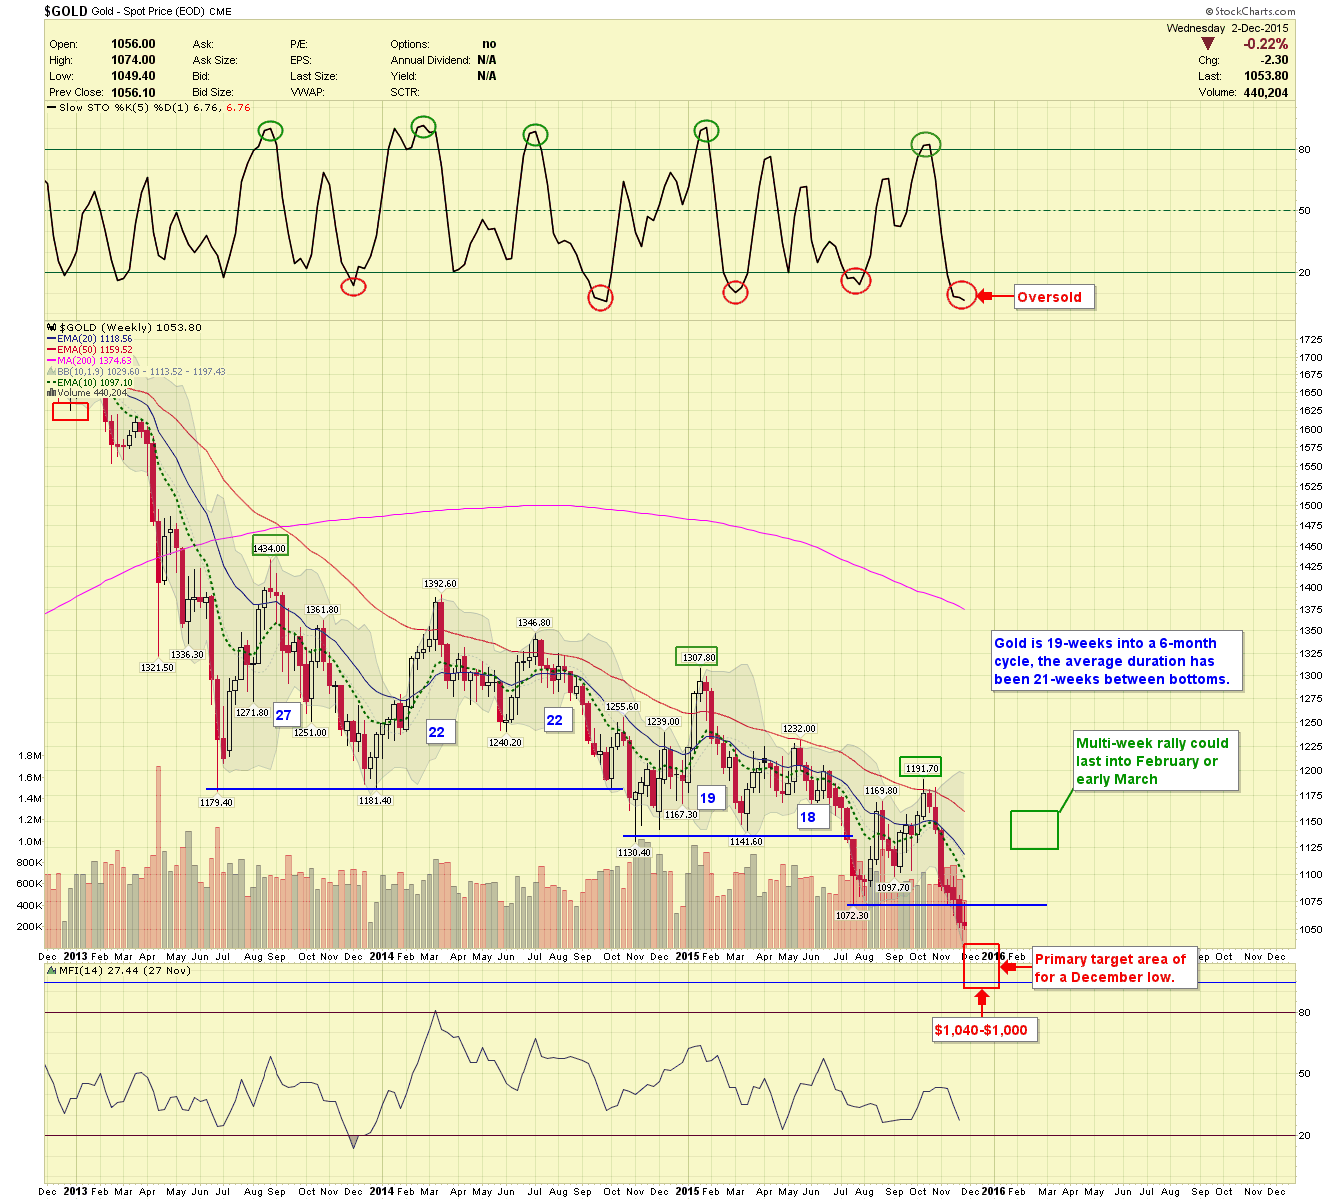
Near-term forecast: Gold, Silver and Miners are approaching a 6-month cycle low. We will be looking at mid-December and the FED meeting for the potential bottom. Prices should find support at $1,040-$1,000 in gold. However, a temporary dip under $1,000 is not out of the question especially if the FED decision on December 16th shocks. Once the 6-month bottom arrives gold, silver and miners should begin a multi-week rally.
Below is the weekly chart for gold. Prices have reached oversold levels and at 19-weeks we should be close to a low. Everything hinges on what the FED does but our primary target is still intact. Once the bottom arrives, we should rally into February.
Weekly Gold Chart
During my tenure, I’ve spent thousands of hours studying the gold and silver charts. Looking for the perfect system, I used every indicator, oscillator, moving average and analytic technique imaginable, back testing all of them. I finally realized that no single tool is perfect, and nothing works 100% of the time. I did find however that some of these tools when combined with cycle analysis forecasted tradable bottoms while bringing a certain level of stability to these otherwise volatile commodities.
********
Our goal is to navigate subscribers through the next several months to the 8-year cycle low. After that making money in the metals should get much easier. We are raising capital, and I’m making a list of quality mining companies to buy at the 8-year low.
Stop by and visit us at www.BuyGoldPrice.com to see if our service is right for you.


