Gold Set For Very Bullish 2017


I am very bullish on the gold price in 2017. Since the year has got off to a cracking start, I believe we need to see a test of the recent low to lay a stronger foundation from which to launch even higher.
Let’s review the charts beginning with the long term picture.
GOLD QUARTERLY CHART
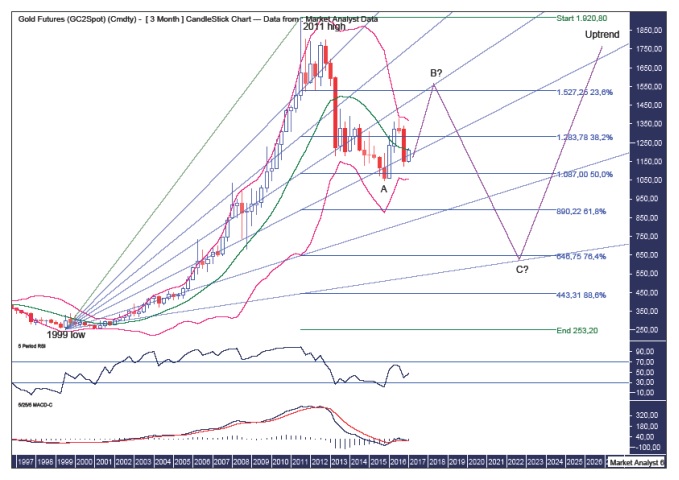
There is no change to the longer-term outlook whereby I believe an ABC corrective pattern is in play with price currently tracing out its way to a wave B high.
The Bollinger Bands show price giving support from the middle band a good test and I expect price to eventually move back up to the upper band and push even higher into that band to set up the final rally high.
I have drawn a Fibonacci Fan from the 1999 low to 2011 high. This shows price finding support around the 61.8% angle and I expect the wave B high to be up at resistance from the 50% angle. After that, I am currently targeting the wave C low to be around support from the 88.6% angle, most likely during the next decade.
I have added Fibonacci retracement levels of the whole move up and while price has currently found support from the 50% level I believe the final wave C low will be closer to the 76.4% level at $646. Price hitting the 61.8% level at $890 is my minimum expectation.
The RSI is still in weak territory while the MACD indicator looks to have regrouped somewhat after its downtrend.
GOLD MONTHLY CHART
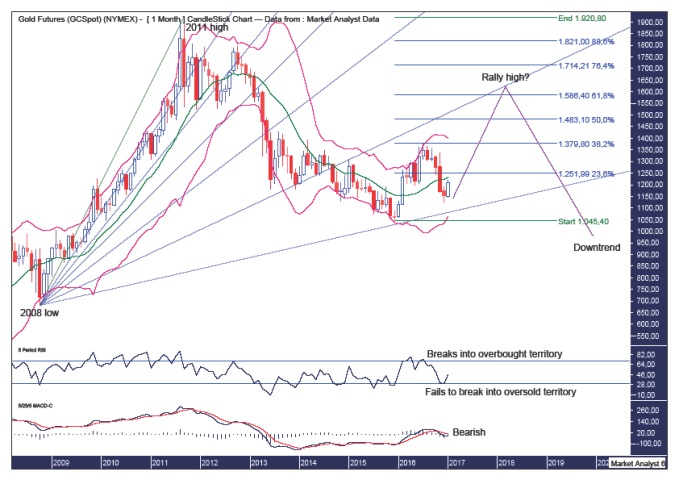
The Bollinger Bands once again show price giving support from the middle band a good test and price now looks to be fighting back.
The Fibonacci Fan drawn from the 2008 low to 2011 high shows this rally taking place between the 76.4% and 88.6% angles and I favour the final rally high to be around resistance from the 76.4% angle.
I have added Fibonacci retracement levels of the move down from the 2011 high and my forecast remains unchanged whereby I believe price will clip the 61.8% level at $1586 before resuming the downtrend.
The recent price high saw the RSI break into overbought territory while the recent price saw this indicator unable to break into oversold territory. This is typical of an uptrend.
The MACD is still bearish so bulls need to be cautious about buying up at these levels.
GOLD WEEKLY CHART
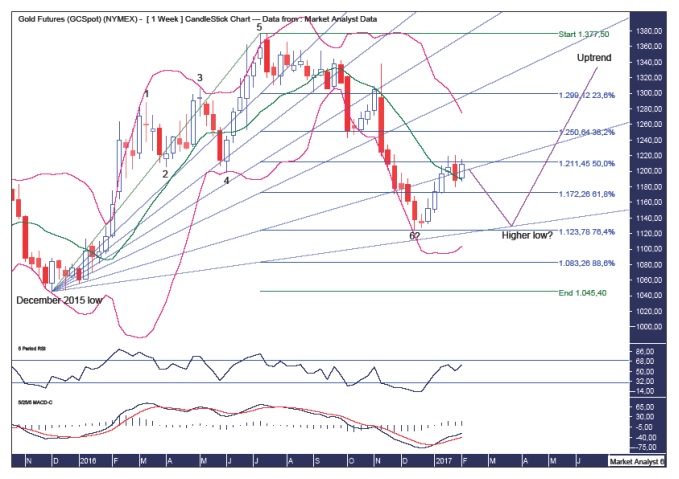
We have been expecting the 5 point broadening top to morph into a more bearish 7 point top and I believe we now have the point 6 low in place at $1124. It is possible for one last marginal low although I personally favour a higher low to form. Let’s see.
This point 6 low was bang on the 76.4% Fibonacci retracement level which is an excellent spot for a trend change to occur.
The Fibonacci Fan shows price is currently nudging the 76.4% angle and I favour resistance to come in and send price back down to test the recent low which was just above the 88.6% angle. I would like to see this 88.6% angle given more of a test and perhaps we will get that test on this next move down and which sees a higher low form.
The RSI showed a new low at the recent low and the fact that no bullish divergence formed needs to be kept in mind. A marginal new price low will probably coincide with a bullish divergence here.
The MACD indicator is bullish although still in negative territory.
Summing up, I am very bullish for 2017 although I am currently bearish over the short-term, expecting a test of the low in the next month or two.
© 2017 Copyright The Voodoo Analyst - All Rights Reserved
Disclaimer: The above is a matter of opinion provided for general information purposes only and is not intended as investment advice. Information and analysis above are derived from sources and utilising methods believed to be reliable, but we cannot accept responsibility for any losses you may incur as a result of this analysis. Individuals should consult with their personal financial advisors. Put simply, it is JUST MY OPINION.
More from Gold-Eagle


