Gold & Silver Update


Fundamentally, Gold is now starting to move into the final 3rd phase of this long term bull market. 1st stage saw the miners closing their hedge books, 2nd stage continuously presented us news about institutions and central banks buying or repatriating gold. The evolving 3rd and finally parabolic stage will end in the distribution to small inexperienced new investors who will be subject to blind greed and frenzied panic.
Arguments For Lower Prices
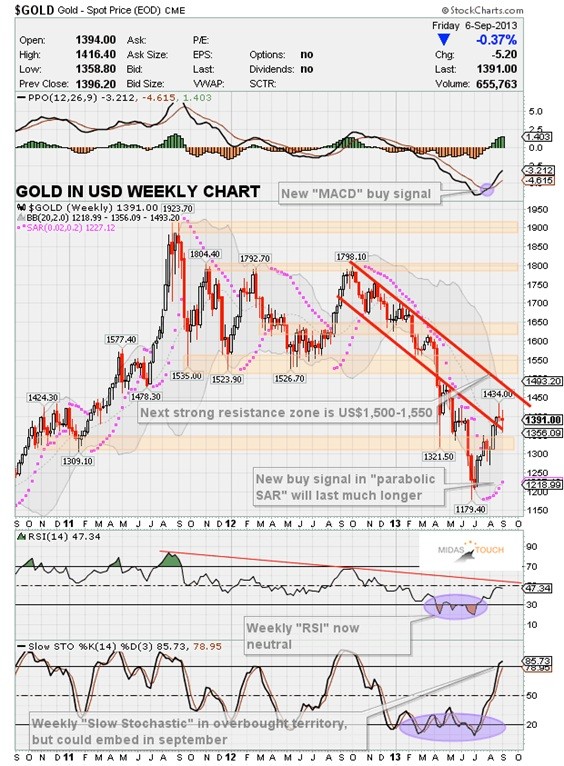
• Gold overall still in a downtrend. US$1,525 is the line in the sand. Gold will need much more time to break through this heavy resistance.
• MACD sell signal on monthly chart still active.
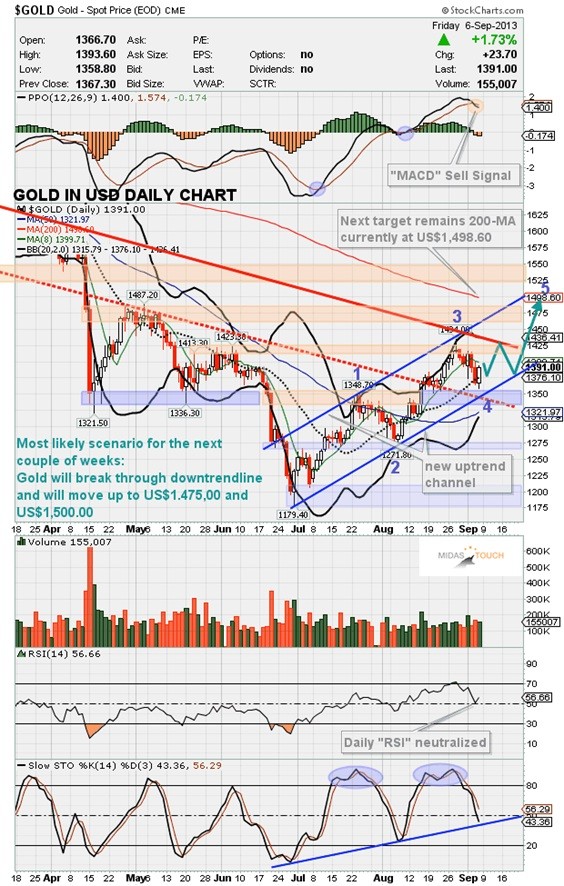
• New MACD sell signal on the daily chart.
• HUI Gold Bugs Index did not confirm Gold´s recent high at US$1,432.
• Still excessive optimism in HUI Gold Bugs sentiment according to latest sentiment report.
• US-Dollar at 50-MA (82.28) support on the daily chart and above 200-MA (81.68).
• US stock market looks toppy and in distribution modus. Situation smells like 1987. If stock markets start crashing precious metals might get into troubles as well (risk off).
Arguments For Higher Prices
• MACD buy signal on the weekly chart.
• Gold is above 50-MA (US$1,321.97). Next target automatically and naturally is the 200-MA (US$1,498.60).
• Gold retested old highs around US$1,355 on Friday and strongly reversed higher.
• Gold´s daily chart clearly shows a new uptrend with 4 waves since the June lows. Currently wave 4 is about to finish or has already been finished last Friday. Wave 5 (in commodities often the sharpest one) should take gold towards US$1,500.
• CoT-Data for COMEX Gold: commercial short position still very low.
• The seasonal cycle for precious metals remains extremely positive. September statistically best month of the year.
• For the first time in 2013 Gold is going up versus all four major world currencies at once, this is a very strong buy-signal.
• Only mild correction in the mining stocks so far.
• US$ at Bollinger-Band resistance (82.56) on the daily chart.
• Bond yield reaches a 2-year high. The 10-year Treasury Note yield cleared 5 five-year resistance and psychologically important level at 3%. In this environment Gold might be acting as safe haven.
Conclusion – Long-Term
• Nothing has changed
• Precious Metals bull market continues and is moving step by step closer to the final parabolic phase (could start in summer 2014 & last for 2-3 years or maybe later)
• Price target Dow Jones/Gold Ratio 1:1
• Price target Gold/Silver Ratio 10:1
• Fundamentally, Gold is now starting to move into the final 3rd phase of this long term bull market. 1st stage saw the miners closing their hedge books, 2nd stage continuously presented us news about institutions and central banks buying or repatriating gold. The evolving 3rd and finally parabolic stage will end in the distribution to small inexperienced new investors who will be subject to blind greed and frenzied panic.
Germany
E-Mail: [email protected]
Website: www.goldnewsletter.de
 Florian Grummes (born 1975 in Munich) has been studying and trading the Gold market since 2003. In 2008 he started publishing a bi-weekly extensive gold analysis containing technical chart analysis as well as fundamental and sentiment analysis. Parallel to his trading business he is also a very creative & successful composer, songwriter and music producer. You can reach Florian at: [email protected].


