Gold Stock Profits: A Horn Of Plenty


Gold drifts sideways in typical weak season trading, silver looks better, and the miners look awesome!
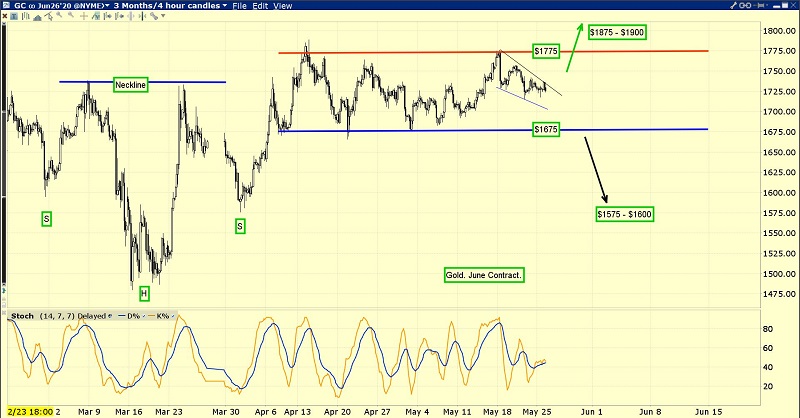
The gold chart.It’s clear that both upside and downside breakouts are failing, and the gold price continues to ooze sideways.
A rectangle pattern is in play.The good news is that basis the Edwards and Magee technical analysis handbook, there’s probably about a 67% chance that the breakout will be to the upside.
Even if it’s to the downside, the target area is at $1575-$1600, which is mild corrective action.
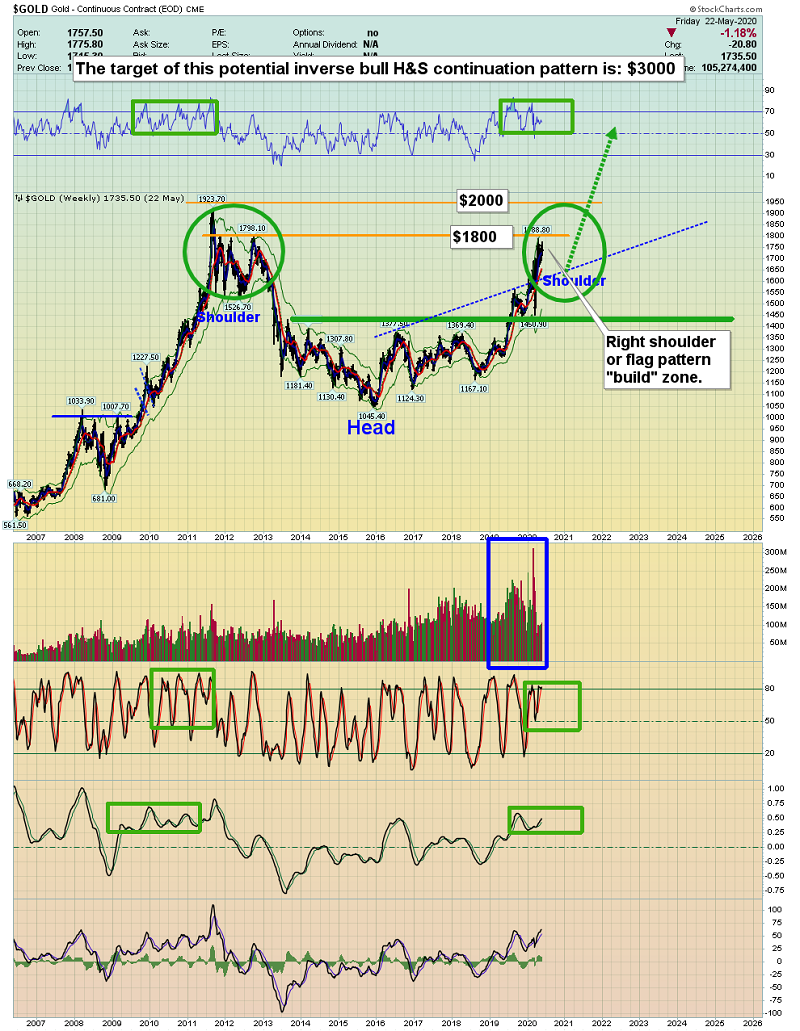
The long-term gold chart.The $1800 area is a selling area because it is a resistance zone, but it’s also the build zone of a huge inverse H&S bull continuation pattern (where the right shoulder could become a flag!).
Gold market investors need to be careful about selling too much and becoming too boisterous in making “top calls” in this key area.
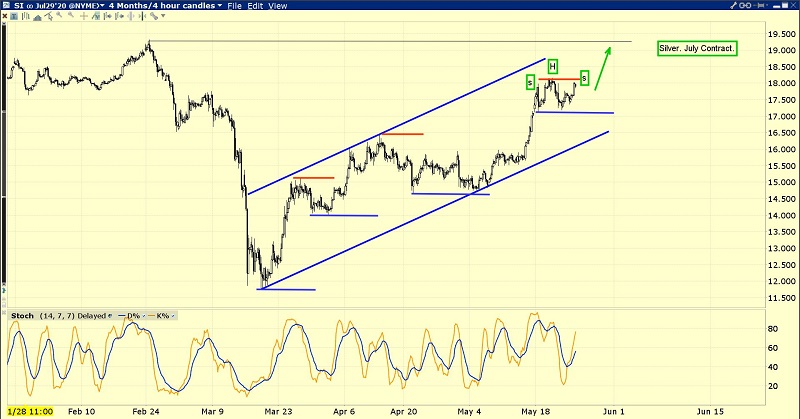
The magnificent silver chart.
A small H&S top formed, but I expect that the “King of Assets”, will push higher and destroy that pattern.
Silver was hurt more than gold as the stock market swooned in the initial stage of the Corona crisis.
Now, as the Fed money printers and government debt worshippers pull out all the stops to get their stock market “poster boy” higher…
Silver is leapfrogging over gold.
On the COMEX this morning, gold is down about $10/ounce, and silver is up, with the Dow up about 500 points.Silver has diverged from gold quite frequently during this stock market surge.
Nouriel Roubini has recently done a spectacular interview with the New York Mag Intelligencer.
He presents a sobering vision of what lies ahead for America.Just a few small rate hikes could turn the catastrophically weak economy and debt-obsessed government into an economic gulag.
It’s the same scenario I’ve predicted, and the weekly gold chart price action suggests the odds of it happening are at least 90%.
The government failed to save.It failed to prepare for any type of crisis, and it failed to get rid of the diabolical graduated income tax that fuels its never-ending size growth.
Once the stock market poster boy implodes, the government emperor will be shown not only to have no clothes, but no skin, heart, or brain!
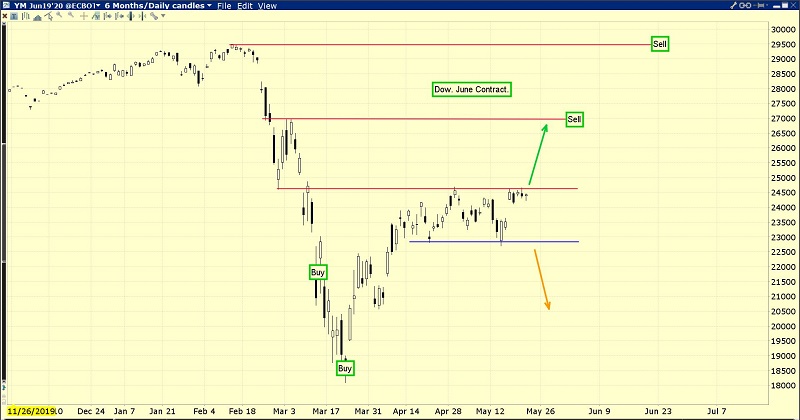
The US stock market chart.
I’ve highlighted my key buy zones at 21,700 and 18,3000.The entire 27,000-30,000 area is a sell zone.I plan to sell there, with gusto!
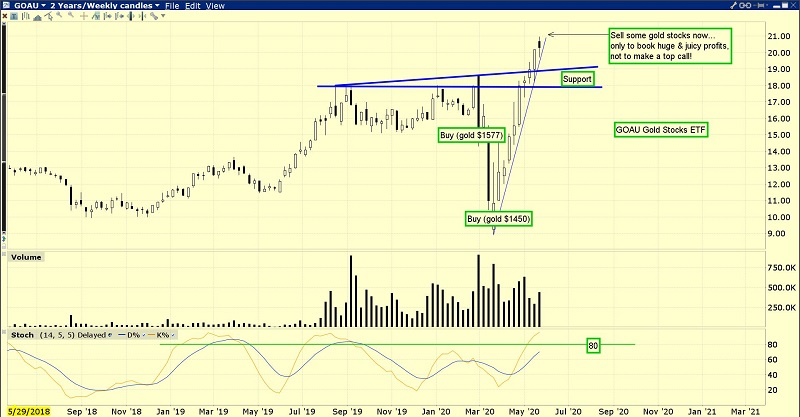
This is obviously one of the world’s most spectacular ETFs, GOAU-AMEX.
Note the action of my 14,5,5 series Stochastics oscillator, which I affectionately refer to as “Leo the Lion”.The bottom line is when a key weekly chart oscillator becomes overbought, it may quickly drop, or it can stay overbought for quite a long time.
In the case of GOAU and most big-name gold stocks, I suggest that investors wait for that oscillator to drop under 80 before getting at all concerned about the health of this rally.
The only reason to sell perhaps 10%-30% of gold stock positions now, is because the profits on miners bought at my gold $1577 and $1450 buy points are fabulous!The time to sell is when the investor feels fantastic.
For some investors, that time is now.For others, that time lies ahead, but this metals market rally has legs, especially for the miners and silver bullion.A horn of plenty is in play, and everyone in the gold community can get their profit booking day!
Special Offer For Gold-Eagle Readers: Please send me an Email to [email protected] and I’ll send you my “ETFs Versus Individual Miners!” free report. I highlight the unique risks and rewards associated with key individual miners and ETFs, so investors can decide whether to own the miners, the ETFS, or both! I include buy/sell points of action for each item.
Note: We are privacy oriented. We accept cheques, credit card, and if needed, PayPal.
Written between 4am-7am. 5-6 issues per week. Emailed at aprox 9am daily.
Email:
Rate Sheet (us funds):
Lifetime: $999
2yr: $299 (over 500 issues)
1yr: $199 (over 250 issues)
6 mths: $129 (over 125 issues)
To pay by credit card/paypal, please click this link:
https://gracelandupdates.com/subscribe-pp/
To pay by cheque, make cheque payable to “Stewart Thomson”
Mail to:
Stewart Thomson / 1276 Lakeview Drive / Oakville, Ontario L6H 2M8 Canada
Stewart Thomson is a retired Merrill Lynch broker. Stewart writes the Graceland Updates daily between 4am-7am. They are sent out around 8am-9am. The newsletter is attractively priced and the format is a unique numbered point form. Giving clarity of each point and saving valuable reading time.
Risks, Disclaimers, Legal
Stewart Thomson is no longer an investment advisor. The information provided by Stewart and Graceland Updates is for general information purposes only. Before taking any action on any investment, it is imperative that you consult with multiple properly licensed, experienced and qualified investment advisors and get numerous opinions before taking any action. Your minimum risk on any investment in the world is: 100% loss of all your money. You may be taking or preparing to take leveraged positions in investments and not know it, exposing yourself to unlimited risks. This is highly concerning if you are an investor in any derivatives products. There is an approx $700 trillion OTC Derivatives Iceberg with a tiny portion written off officially. The bottom line:
Are You Prepared?
********
 Stewart Thomson is president of Graceland Investment Management (Cayman) Ltd. Stewart was a very good English literature student, which helped him develop a unique way of communicating his investment ideas. He developed the “PGEN”, which is a unique capital allocation program. It is designed to allow investors of any size to mimic the action of the banks. Stewart owns GU Trader, which is a unique gold futures/ETF trading service, which closes out all trades by 5pm each day. High net worth individuals around the world follow Stewart on a daily basis. Website: www.gracelandupdates.com.


