Gold Stocks, Silver, Oil, Natural Gas & SPX Trading Newsletter


The market continues to whipsaw traders out of positions as volatility rises. I have put together a few charts to show you where each of our commodities are trading along with the SPX (SP500 index).
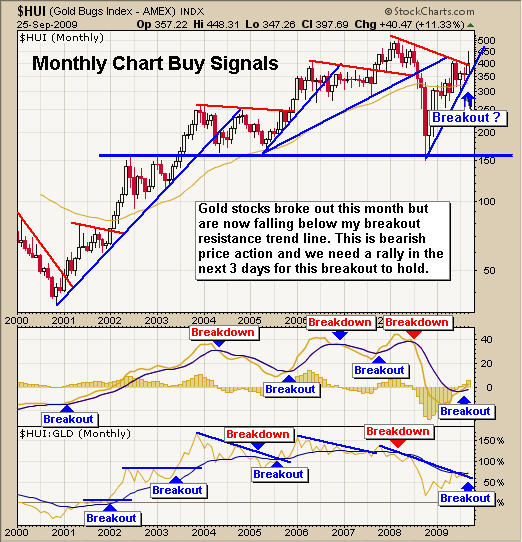
My Gold Stock Breakout Model - Monthly Chart
I use this chart to keep my big picture trades on the right side of gold. I found that gold stocks tend to lead the price of gold so watching this gold stock index on the monthly, weekly and daily charts can provide me with short term tops and bottoms for trading gold bullion, GLD or DGP exchange traded funds.
The monthly chart clearly shows the rally in stocks has now sold back down to my resistance trend line. If we do not get a rally this week in gold stocks, then I think we could see gold trade sideways or down for several months.
GLD Gold ETF Trading Fund - Newsletter
The daily gold bullion fund shows the recent price action and what I think could happen in the coming weeks. In the past couple days gold has moved to a short term support level where I think we could see buyers step in.
We took some profits near the high and continue to hold a core position until we have another technical breakdown or new setup to add more to the position again.

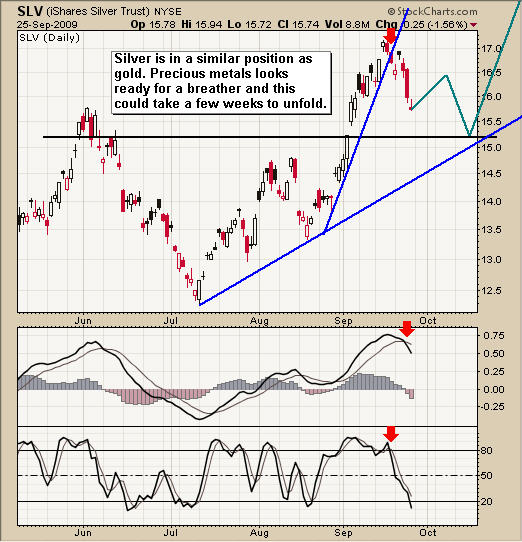
SLV Silver ETF Trading Fund - Newsletter
Silver is in the same boat as gold. We have taken some profits and are still holding a core position with protective stops in place just incase the market does head lower from here.
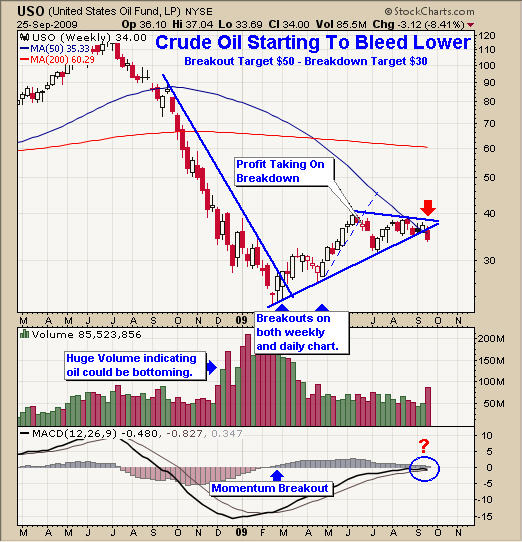
USO Crude Oil Trading Fund - Newsletter
Crude oil started to bleed lower last week as the price sliced through the multi month support trend line. Volume shot up as stop orders get triggered on the way down. We finally have a move outside of the pennant formation that has been in place for several months. Now we can start looking for a low risk setup for trading crude oil again.
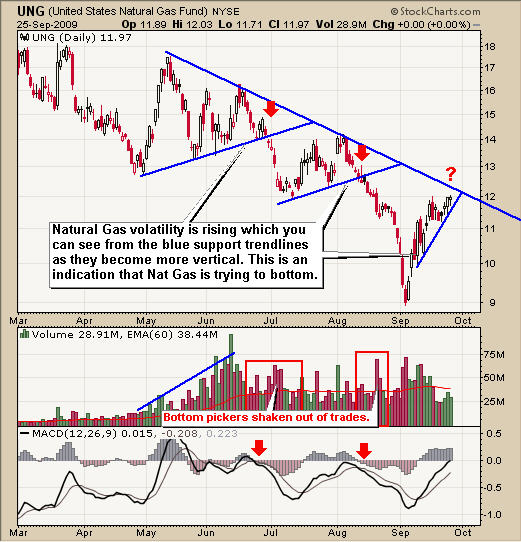
UNG Natural Gas Trading Fund - Newsletter
Natural gas has really come back to life. I mentioned on September 2nd that natural gas (UNG) looked like a buy between $9 - $9.50 and it has now rallied 25% since that point. But stepping back and looking at the chart we can see resistance is hovering over head between the $12 - $12.25.
I may send out a setup for a short play if we get one but I feel the heavy sell off in August was the final wave down, flushing out traders. Speculative traders seem to have moved into natural gas and I think they will continue to buy it for some time. Pullbacks will be sharp but most likely followed with more buying as we enter the cooler months of the year.
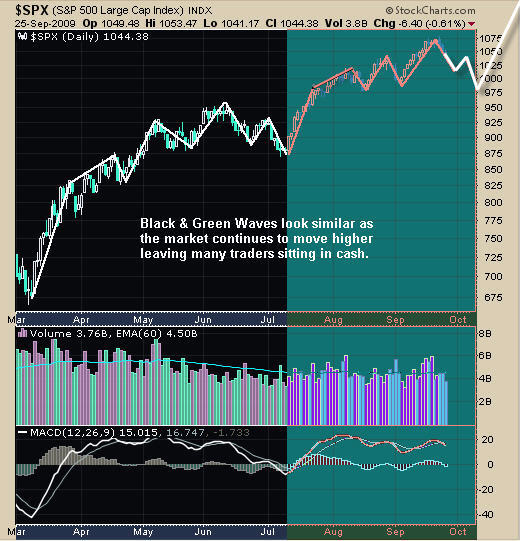
SPX Index Trading - Active Trading Partners
I thought that I would show a quick picture of the SPX because it shows the psychology of traders and how it repeats it's self over and over. The black and green waves are virtually the same patterns.
I feel as though the market is ready for a larger pullback than what we had in June/July but my focus will be to buy in the oversold dips and lighten my positions in overbought conditions (scaling in and out of positions) until the trend confirms it has reversed.
My Market Trading Newsletter Conclusion
Gold stocks are pulling back and precious metals continue to move with the overall market action. I do feel that gold and silver will break this relationship and start to move higher in the coming months but until that happens I remain cautious with my positions tightening my stops.
Crude oil is starting to come alive and I am now looking for some low risk setups for energy related funds. Last week's technical breakdown could provide us with a big move in the coming months.
Natural Gas continues to hold up but is now trading near resistance. Depending how many spec traders there are still lingering around (as most lost their shirts in the recent months), will dictate how much higher natural gas will move. The 25-30% rally in the past month has been very powerful and this could be just the beginning. I am now waiting for another setup that could be a long or a short trade depending on what happens next.

Chris Vermeulen has been involved in the markets since 1997 and is the founder of Technical Traders Ltd. He is an internationally recognized technical analyst, trader, and is the author of the book: 7 Steps to Win With Logic
Through years of research, trading and helping individual traders around the world. He learned that many traders have great trading ideas, but they lack one thing, they struggle to execute trades in a systematic way for consistent results. Chris helps educate traders with a three-hour video course that can change your trading results for the better.
His mission is to help his clients boost their trading performance while reducing market exposure and portfolio volatility.
He is a regular speaker on HoweStreet.com, and the FinancialSurvivorNetwork radio shows. Chris was also featured on the cover of AmalgaTrader Magazine, and contributes articles to several financial hubs like MoneyShow.com.


