Gold Update: Major, Post-Peak-Chaos Breakout in the USDX
After Friday’s comprehensive analysis, today’s issue is going to be quite brief. The reason is that there is only one major development happening right now, and what’s happening in gold is rather erratic.
Gold Futures Spike Amid Market Discrepancy
Starting with the latter, the gold futures market is up by 1.7% without any confirmation in other markets. Silver futures are down, while spot gold and spot silver are slightly down. The GLD and GDXJ ETFs are both down in today’s pre-market trading. GLD only slightly, and GDXJ is down by 0.9%.
So, at this point I see no reason for the anomaly in gold’s futures continuous contract to change anything regarding the outlook.
What does change something related to outlook is what we see in the USD Index.
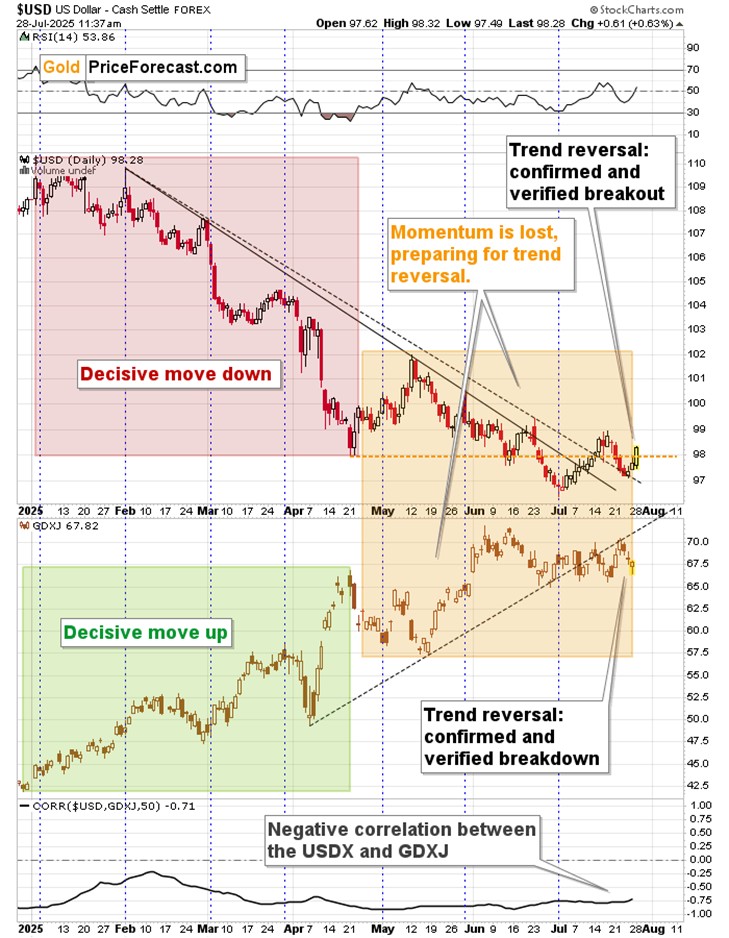
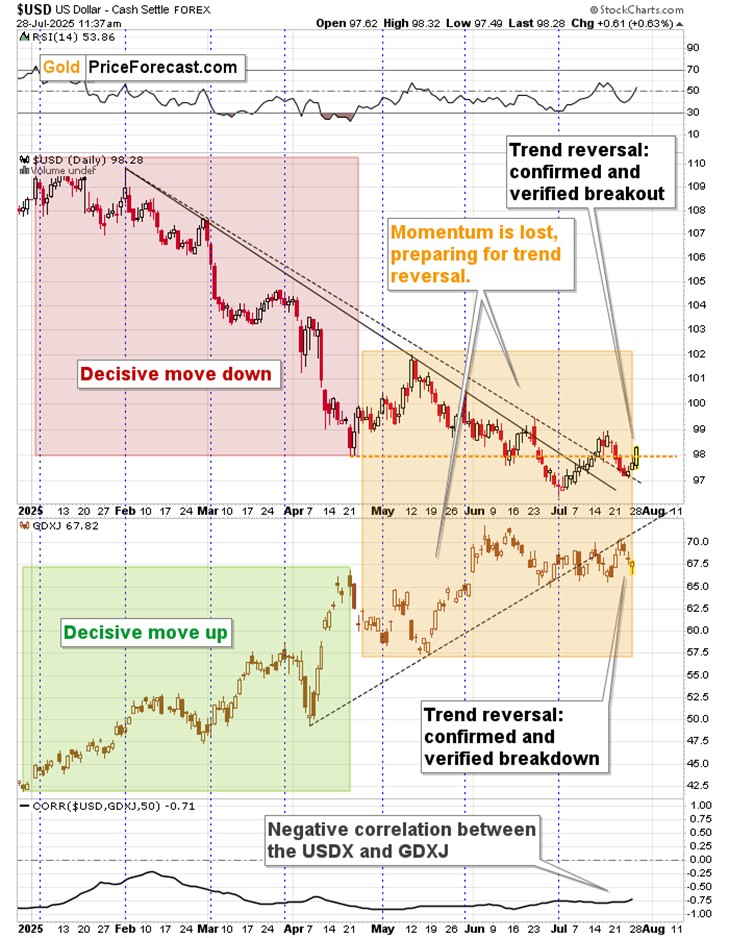
Namely, the USD moved clearly higher today, and it moved back above its April low.
This is completely unsurprising as it’s perfectly in tune with the Peak Chaos theory and with the way USD behaved before the previous tariff deadline – and you know about both. Quoting:
Tariff Deadline Extension Analysis
“The previous tariff deadline situation centered around June 1st, 2025, when Trump initially threatened to impose 50% tariffs on European Union imports. However, on May 25th, 2025 - just 6 days before the deadline - Trump agreed to postpone this deadline to July 9th following a phone call with EU Commission President Ursula von der Leyen. This represented a clear pattern of last-minute flexibility that markets began to anticipate.
The July deadlines presented a more complex scenario, with July 8th marking the expiration of a 90-day pause on "reciprocal tariffs" and July 9th being the extended EU deadline. Importantly, Trump signaled his flexibility much earlier this time. On June 27th, 2025 - about 11-12 days before the deadlines - he stated "No, we can do whatever we want" when asked if the July deadlines were set in stone, indicating they could be extended or shortened. This earlier communication of flexibility represents a key difference from the June pattern.
What makes this particularly relevant for USD Index analysis is that the dollar bottomed on July 1st, 2025 - precisely 7-8 days before the July deadlines. This timing wasn't coincidental. The market had learned from the June experience that Trump tends to provide flexibility around tariff deadlines, and the July 1st USD bottom occurred right after his June 27th comments about deadline flexibility. Markets essentially front-ran the expected postponement.
Looking at the current August 1st deadline, we can draw several important lessons. If the historical pattern holds, we might expect some form of communication about deadline flexibility approximately 6-12 days before August 1st - which would place it around July 20th-26th, 2025. Given that it’s [July 23], we're likely in the middle of this expected communication window.
However, there's a crucial difference this time. The USD Index has already demonstrated significant strength since its July 1st bottom, breaking above key resistance levels and showing what appears to be a confirmed uptrend reversal. Unlike the previous situations where tariff uncertainty created dollar weakness, the market now seems to be pricing in that tariffs are fundamentally bullish for the USD. This suggests that even if August deadlines are postponed, the USD Index may not revisit the July 1st lows, as the fundamental narrative has shifted from "tariff chaos equals dollar weakness" to "tariff implementation equals dollar strength."
The pattern suggests that while we might see some near-term USD volatility around potential August deadline communications, any weakness would likely be limited and short-lived compared to the previous cycles, as markets have now embraced the longer-term bullish implications of the tariff policy for dollar strength. That’s exactly what the confirmed breakout indicates on the technical front.
Let me write this again – tariff implementation equals dollar strength – and we already see it in the markets.”
Yesterday, we got information about the 15% trade deal with Japan and there’s a good chance that the EU will also face 15% tariffs. This is EXACTLY what the Peak Chaos theory implies at this stage – all this confirms it further. This is where Trump needs some wins to demonstrate that his approach is working. This is also where fundamental and emotional forces are starting to work in tune for higher USD Index values.
Timing-wise, we are in the analogy to the July 1 bottom right now, and here is the key thing that I want to stress today:
The USD Index didn’t soar right on July 1, even though that was the bottom. It didn’t rally on the next day, either. The rally was gradual. If this is the historical template, it’s also the most likely outcome here. Consequently, the current consolidation is in perfect tune with the pattern – it doesn’t invalidate it.
It continues to support higher USD values in the following days and weeks.
And you know what this means for mining stocks – declines. Most likely big declines, just as the rally in the USD is likely to be big, as the latter is starting it from very oversold levels.
That’s exactly what happened – the USD Index bottomed on July 23 (closing price) / July 24 (intraday), which was 8-9 days before the deadline – in perfect alignment with the 6–12-day window that I had featured.
Today’s comeback above the April low, the bigger size of the rally and the fact that the bottom formed at the declining support line all perfectly support the bullish case for the USD Index for the following weeks.
Let me paste that chart for your convenience once again.
I’ve divided this chart into two parts. The first one shows decisive moves in both: USDX and GDXJ and this period ended in mid-April.
Everything that happened after that time was a consolidation that pretended to be moves continuation. The USD Index moved only a bit lower over the course of the following months, and the GDXJ moved only a bit higher.
And now it all changed. The breakout in the USD and the breakdown in the GDXJ are crystal-clear. They were confirmed by multiple daily closes and with comebacks to the previously broken lines. This is the most classic way possible for the markets to change their direction.
Those are no minor moves, either. The USD’s support line was previously resistance for months – it started at the beginning of the year. So, yes, what we saw at the beginning of this month was likely the yearly bottom for the USD Index – and we quite likely saw a yearly top for the GDXJ.
The moves that follow major breakouts / breakdowns tend to also be major. In our case, we’re looking for a medium-term price swings, lasting between weeks to months. My best guess is that we’ll see declines in the precious metals market perhaps until the end of the year. We’re after Peak Chaos, after all, and gold failed to soar to new highs even despite a military conflict with Iran and Israel when nuclear facilities were targeted.
Unlike the vast majority of market participants, you are well-positioned to take advantage of what’s next.
Thank you for reading my today’s analysis – I appreciate that you took the time to dig deeper and that you read the entire piece. If you’d like to get more (and extra details not available to 99% investors), I invite you to stay updated with our free analyses - sign up for our free gold newsletter now.
*******


 Przemyslaw Radomski,


