Gold Update: Market Wrap-Up for November 7th


In the past month, the Dow Jones has made four new all-time highs (BEV-Zeros = 0.0%) in the chart below, the last on October 28th, just last week. Can’t complain about that, or that in the past week, the Dow Jones hasn’t seen a BEV value below -2%, in its BEV chart below. So far, the Dow Jones remains firmly in scoring position, so we should assume the current advance has not seen its last all-time high.
I’m not calling this stock market a buy. As measured by dividend yields, the stock market is grossly overvalued, and so not a place to risk your money. But from the standpoint of entertainment, just watching something for the joy of doing so, I think my proxy for the broad stock market (the Dow Jones) current advance is fascinating. And it isn’t only the stock market that I find fascinating, but also the “market experts,” people who should know better, who continue advising the public to buy this market.
Some things never change. As they said over 100 years ago on Wall Street, “they never ring a bell when it’s time to sell.” No, they’ll keep telling the investment public to “buy on market weakness,” until Mr Bear makes it clear to everyone, the party is over.
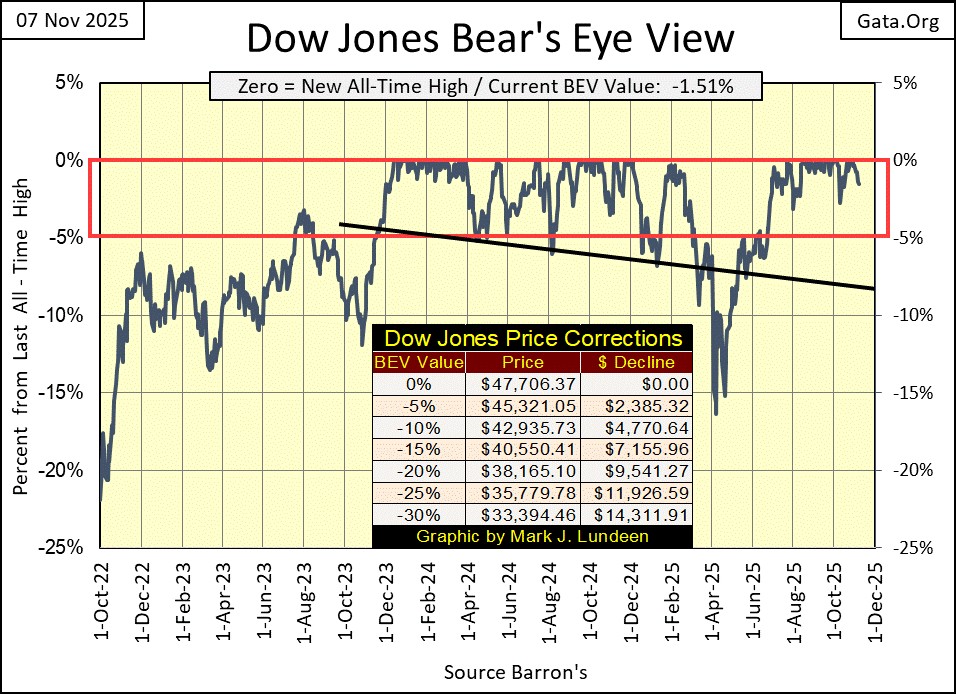
But with the Dow Jones’ BEV value of -1.51% in the chart above, well within scoring position, above its BEV -5% line, this continues to be a time to dream of new all-time highs, in the weeks and possibly months to come.
What could change my opinion about that? Oh, something like seeing the Dow Jones BEV value fall below its lows of last April, below its BEV -15% line. And we are nowhere near that at this week’s close.
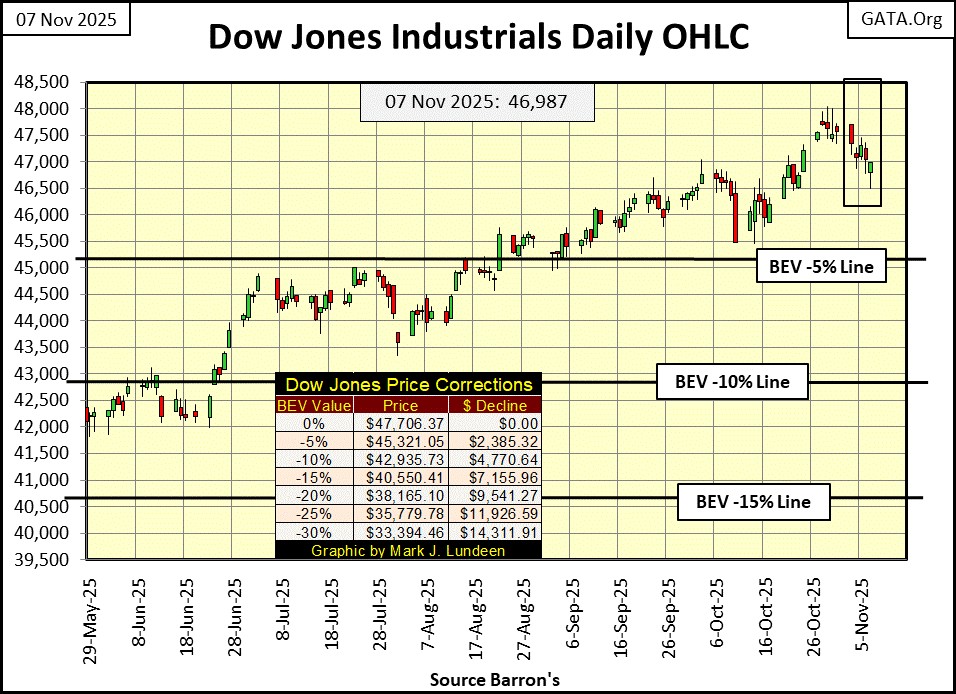
Moving on to the Dow Jones in daily bars below, in the past four weeks, the Dow Jones advanced in three of them, and now in the fourth week, it took a break. Nothing wrong with that, as long as it remains above its BEV -5% line at 45,321. And should it fall below 45,321, that isn’t reason to panic.
Remember, bull markets are peaceful markets. They move both up and down in tiny steps, such as the daily moves seen below. I’ll tell you when to panic; when you see the Dow Jones below, begin to move from day to day in huge moves. Up by 3% one day, followed by a daily decline of 4% the next.
Historically, this is how big bear markets begin; from out of nowhere, daily volatility explodes. With the Dow Jones current lofty elevation, trading over 46,000, a day of extreme volatility, a Dow Jones 2% day, is a daily move of over 900 points from one day to the next. A 3% daily move is something over 1,300 points from one day to the next.
Such huge daily moves now seem impossible, indicating market psychology is still bullish. When Mr Bear returns for his pound of flesh from the bulls, who now are running wild and free on Wall Street, that will be his calling card; an explosion in daily volatility. But, in the daily bar chart below, huge daily swings in prices, both up and down, are missing. Mr Bear, currently, has more important things to do, than inflict pain and suffering on the bulls. One day he will, but most likely not next week.
Looking at my table of BEV values for the major market indexes I follow, this week saw only one BEV Zero, one new all-time high on Monday for the NASDAQ Industrials (#11). In the past few weeks, we’ve seen many 0.0%, new all-time highs in this table. So, the bulls this week took a break; that is how it goes sometimes.
This advance isn’t finished, not with sixteen of these indexes closing the week in scoring position on Friday, within the Red Rectangle. Maybe next week, the Dow Jones, and everything else in the table below will close below their BEV -30% lines. Like me sprouting wings, it could happen. But it’s not likely, so I remain a short-term bull.
Looking at this table as if it were a hand in poker, these are strong cards. Why not expect something good to come from them; such as additional new all-time highs in the weeks and months to come?
If there is a problem with this table, it’s the NASDAQ Banking Index, at the bottom of the list. This banking index hasn’t seen a new all-time high since January 2022, while everything else in this table has. I don’t like that.
Do these banks have something bad brewing for the market just outside of the public’s view? I think so, call it post covid commercial real estate that no longer is servicing the mortgages underlying it. Take a walk around a shopping mall. Not many shoppers, and lots of empty space available for rent.
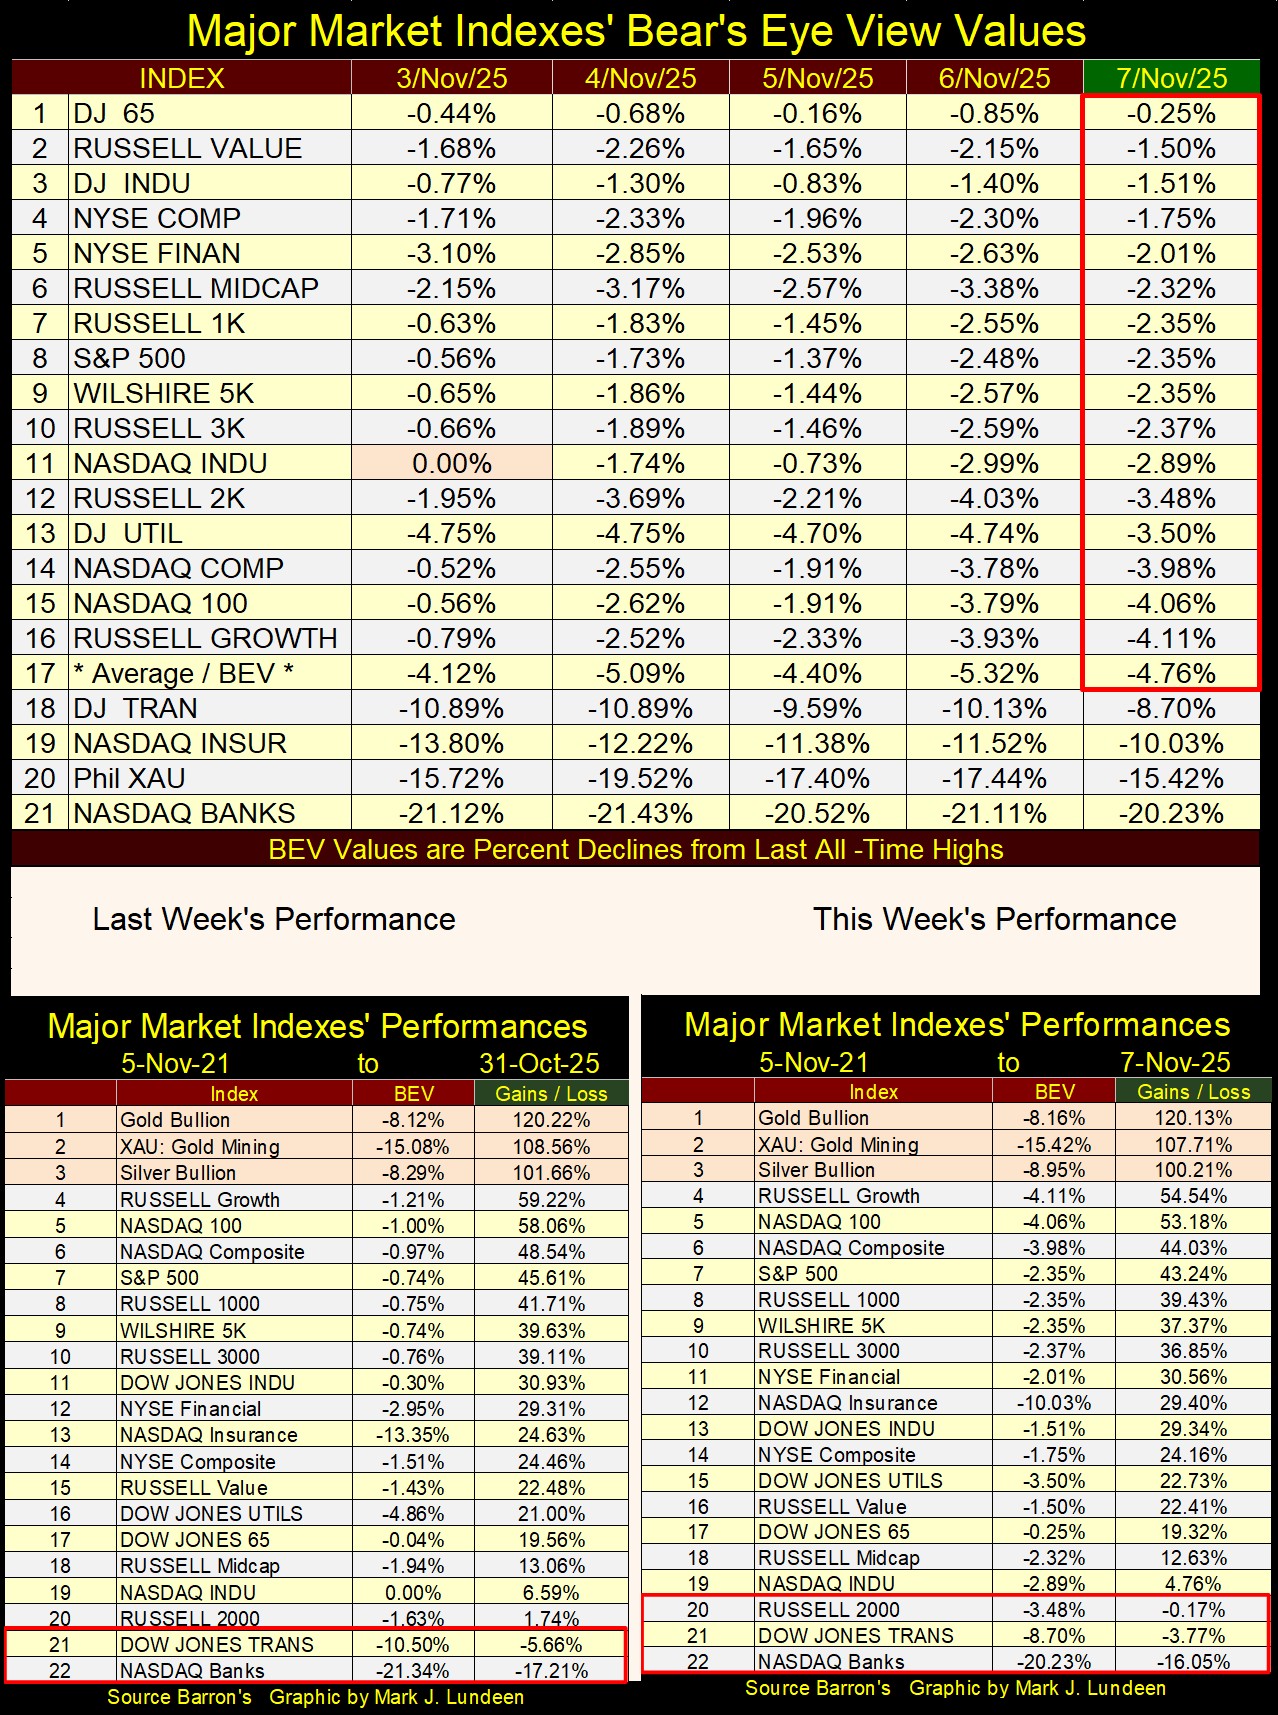
Above, precious metal assets remain in the top three spots in this week’s performance table, down by a trifle from last week’s table.
I note at this week’s close, there were three indexes closing below where they were on 05 November 2021; #20 to 22. When Mr Bear comes to pay the bulls a visit, this is a list destined to grow.
Let’s take a look at the XAU. The top chart below is in the dollars the XAU has been published in since December 1983. This year (2025) the XAU has seen a dramatic break out, far above its all-time highs of April 2011. On October 16th, the XAU closed over $100 above its highs of 2011, and I’m expecting more for the XAU before 2025 comes to its conclusion in the following weeks.
Below, we’re looking at forty-two years of market history, and since 1983, the XAU went from 100 to only 329? In this same time period, the Dow Jones went from 1,250 in December 1983 to 47,706 just last week. Say what you want of the gold and silver miners, being overvalued isn’t one of them. In today’s market, that is a real positive.
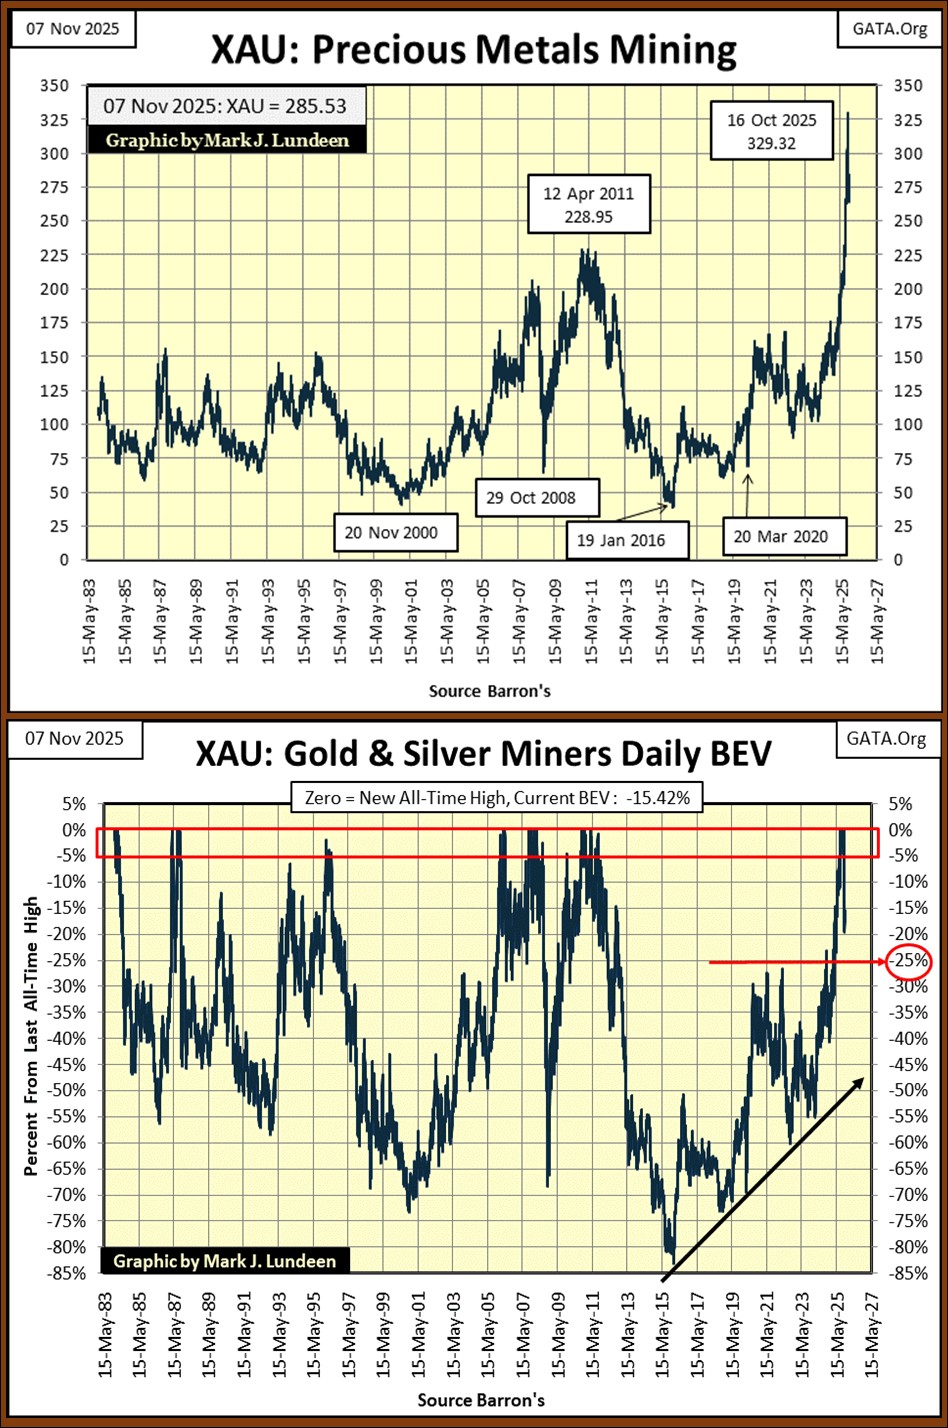
As seen in the XAU BEV chart above, this week it closed 15.42% below its highs of October 16th. But these gold mining shares are a volatile bunch, so I’m not worried about it.
I placed a red line at its BEV -25% line (247). Hopefully the XAU won’t decline below that line. But should it, I wouldn’t like that, but that doesn’t change anything. And exactly what is that? That is, these miners of the old monetary metals, unlike just about everything else trading daily at Wall Street, are compelling values at current prices.
Let’s look at the Barron’s Gold Mining Index’s BEV chart, that goes back to 1920 below. The BGMI bottomed in May 1925, and kept going up until 1937. To refresh everyone’s memory, the Great Depression Market Crash happened from September 1929 to July 1932, and the BGMI continued advancing during the worst of it.
It would be worthwhile for everyone to study this chart, but I’m just going to point out that the deepest bear market bottom in the BGMI occurred on January 2016, (Box C), an eighty-five percent market crash from its April 2011 last all-time high. This was a Great Depression market event, a profound market decline, one that left this sector’s valuation, and public perception of gold mining in the trash.
But history shows that when a market asset declines by 80% or more, the risks to invested funds are at a minimum, while the potential for profits are at a maximum. Why would that be? Because anyone that wanted to sell, has already sold. So, buying at such a bottom is the safest thing one could do with one’s investment funds. But don’t tell anyone, as they’ll think you’re crazy.
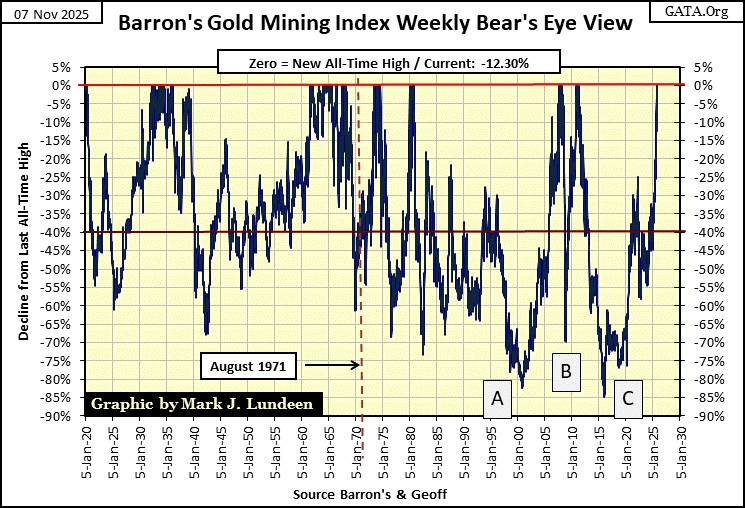
Anyway, today’s market sentiment for the gold and silver miners remains fairly close to where it was in January 2016 (Box C), even if the BGMI is making new all-time highs. That is good, as with time, the investment public will once again want these shares.
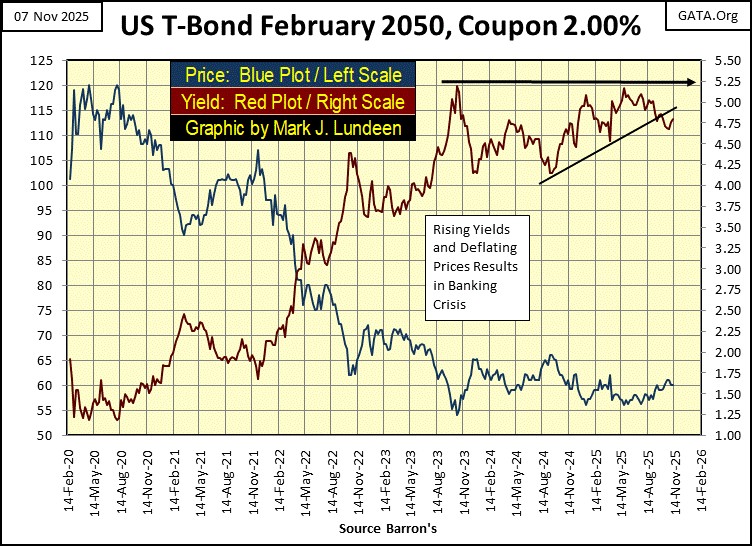
I haven’t covered bond yields for a long time, so let’s take a quick look at this 30Yr T-Bond, issued in February 2020. What a turkey this bond has been for its owners! From its highs of August 2020; 120, at this week’s closing it was trading around 60. That is a loss of 50% for the widows and orphans who were sold it.
For the past two years, since November 2023, its current yield (Red Plot / Right Scale) has so far refused to rise above 5.25%. However, the US National Debt is now over $38 trillion. It was only $26 trillion when this bond was issued in August 2020.
The big-spenders in Washington aren’t going to cut back on wasting the public’s money, though Trump is doing the right thing in allowing the Democrats to shutdown the Federal Government. I hope Trump stands firm. But even so, the National Debt most likely will continue rising, resulting in this, and every other T-bond to see higher yields, and lower valuations in the years to come.
Of course, to “stabilize” the T-bond market, to keep these bond’s yields as low as they currently are, the idiots at the FOMC could always “monetize” (purchase via monetary inflation) these bonds, which would result in massive consumer price inflation.
Which brings up my next chart, indexing US CinC (paper dollars in circulation) and the price of gold. Once, during the gold standard, there was a direct correlation between CinC and the price of gold. The volume of dollars in circulation was pegged to the price of gold at $20.67; so much gold in the US Treasury, so many paper dollars in circulation.
And during the gold standard, people could exchange their paper money for gold coins. A twenty-dollar bill, for a $20 double eagle gold coin, a silver dollar for a paper dollar at their bank. That, plus pocket change was minted in silver, except for pennies and nickels. That was long ago. For many decades now, America’s politicians have done what they damn well please with the dollar, as painfully evident in the chart below.
One thing to note below, is how the 1969 to 1980 bull market in gold (Red Plot / Chart Insert) peaked when the indexed value of gold, spiked above the indexed value of CinC. Did that event trigger the 1980 to 2001 bear market in gold? Maybe. It sure looks like it did. However, this was also a time when all bonds, corporate and Treasury, were yielding well into double digits, as was consumer price inflation.
Soon after gold peaked in January 1980, actually a year later, consumer price inflation began going down, as did bond and dividend yields, meaning money began flowing back into financial assets, and the alure of gold began to fade.
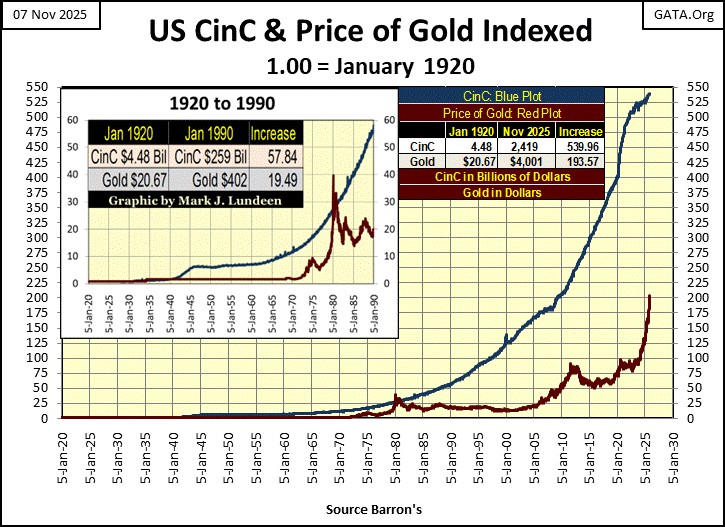
But note above how since the 2000s, gold (Red Plot) is once again rising up to the blue CinC plot. For gold to once again rise up to, and above the CinC plot, the price of gold would now have to increase to over $8000 an ounce. So, with gold currently trading at around $4000 an ounce, as per what is seen above, I think gold is very cheap. Given the choice between the stock and bond market, or gold and silver, the old monetary metals seem the rational choice, as 2025 draws to its conclusion.
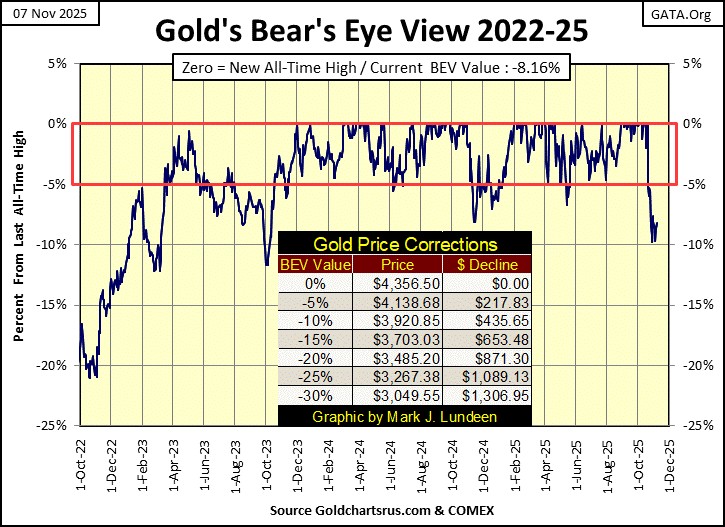
In gold’s BEV chart below, it is currently trading below scoring position, that isn’t good, but for an advance that began two years ago, one must assume corrections will happen. I like seeing gold so far refuse to trade below its BEV -10% line. It may still make a move to its BEV -15% line, but I don’t care. If gold was a bargain at $4356, it’s a bigger bargain at $3703. But at this week’s close, I just don’t see gold going down to $3700. I’ve been wrong before, hopefully not this time.
Below in gold’s step sum table, on October 15th, gold’s 15-count increased to an extremely overbought +11. And as expected, declining days in the gold market soon overwhelmed daily advances. Then, on Thursday this week, gold’s 15-count fell to an oversold -7. Markets don’t like being oversold.
The current selloff in gold may not be over, just yet. We may still see gold’s 15-count decline to a very oversold -9, or even an extreme like a -11. But looking at gold’s step sum table below, the current correction in the price of gold is coming to an end. A month from now, we may once again see gold generate more of those pretty blue BEV Zero in its step sum table below.
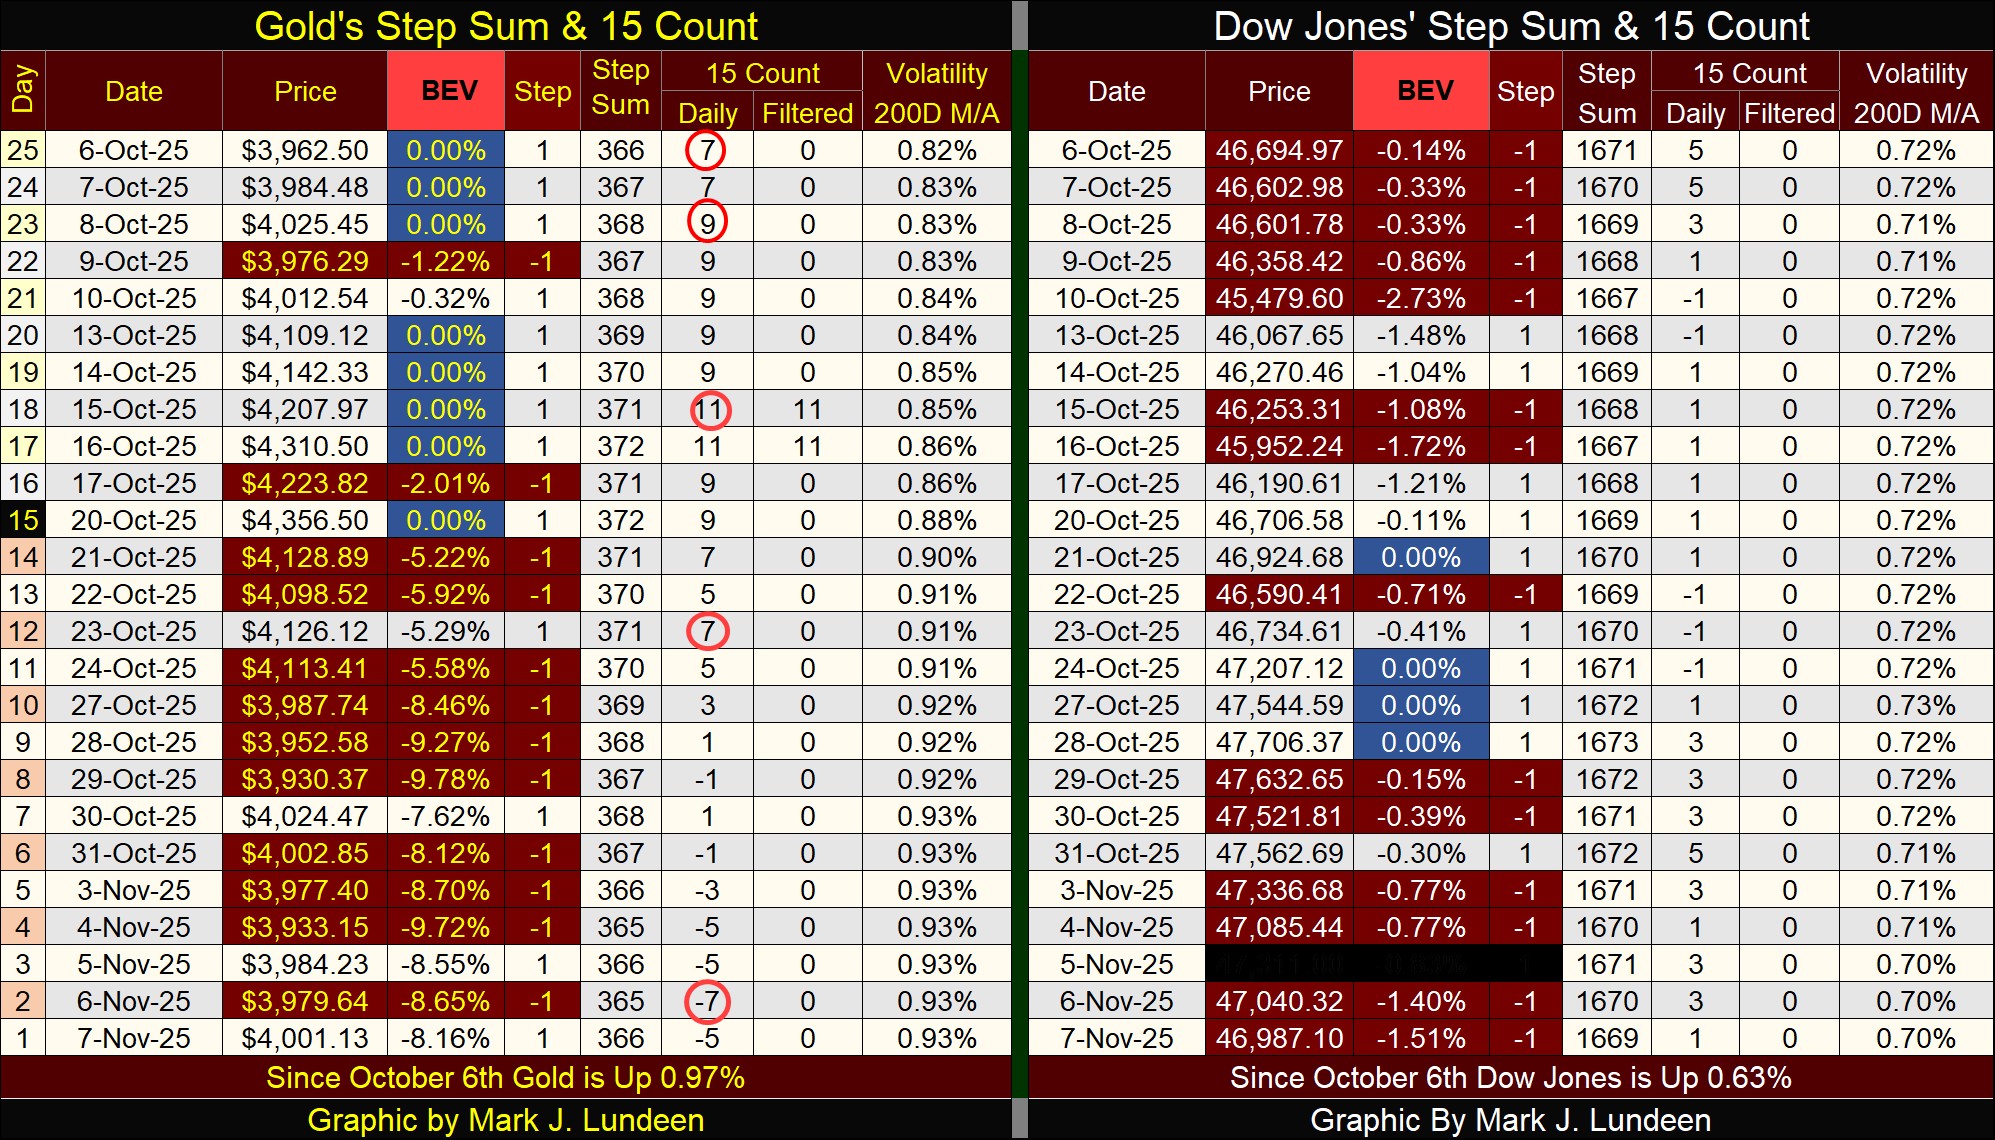
As for the Dow Jones in its step sum table, it too is taking a break in its advance. Like gold, I’m expecting to see the Dow Jones generate additional BEV Zeros in the weeks to come. Look at its daily volatility’s 200D M/A, it has decline to 0.70%. That is bullish for the Dow Jones, even if I’m not.
Given the choice between gold or the Dow Jones. I believe gold, silver too is the logical choice in this market.
For my readers who followed me into Eskay Mining, a gold and silver exploration company, whose massive claim is in the heart of British Columbia’s Golden Triangle, this week Eskay Mining issued a new press release.
https://eskaymining.com/news/news-releases/eskay-receives-high-grade-gold-results-from-the-fi-11647/
The company continues discovering additional sources of rich gold and silver rock samples on their property. For the next season’s exploration program, there will be no shortage of new areas of their massive property to explore.
Also, the results of this year’s program will make Eskay Mining more attractive to a major mining company, for a joint venture, or even a buyout, should the offer be attractive. And the higher the price of gold and silver rises between now and next summer, the more attractive Eskay Mining will become to a major mining company.
The big problem for every major mining company is; they must replenish their ore reserves, or one day they will be out of the mining business. Eskay Mining offers the potential of something that every mining company needs; new sources of ore reserves.
Eskay Mining is a speculation in the gold mining sector. So, don’t bet the farm on it. But, it is the type of speculation where pennies can become dollars. Risking five percent of your funds, targeted for shares of gold mining, in Eskay Mining may prove to be an opportunity to make some life changing money.
Mark J. Lundeen
********


