Gold Update - U.S. Stocks Bracing for Correction
 share
share
 share
share
 share
share
 share
share
 share
share

Last week's trading saw the gold market spiking down to a Monday low of 1817.10 - before bouncing off the same into a Tuesday high of 1864.00. From there, weakness was seen into late-week, with the metal dropping back down to a Friday low of 1822.10.
Gold Market Update
For the near-term picture with gold, the next key bottom is expected to come from the 34-day cycle, which is shown on the chart below:
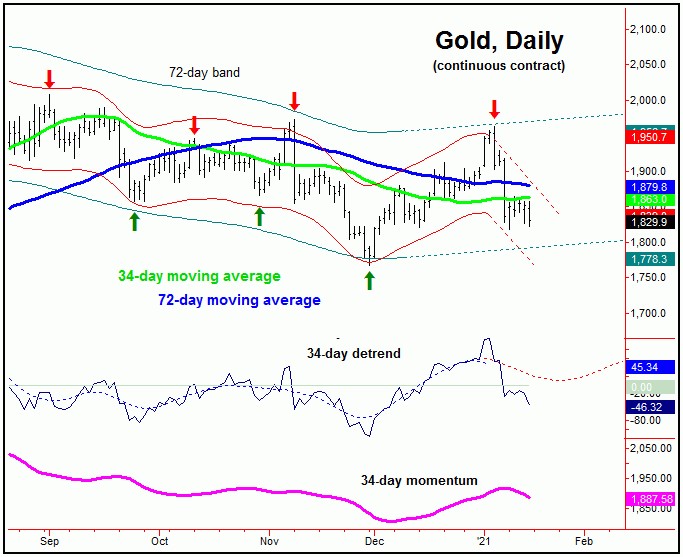
In our Gold Wave Trader report, we were able to confirm the 1962.10 swing top as the last high for this 34-day wave, which is next projecting a late-January trough. With that, the short-term path is looking for additional weakness with this cycle into later this month, though the ideal path is for the move to end up as an eventual countertrend affair - holding above the late-November lows.
Stepping back then, from whatever low that is seen with the 34-day wave late-month, gold should see another sharp rally into the mid-to-late February timeframe, coming from our larger 154-day component, shown again on the chart below:
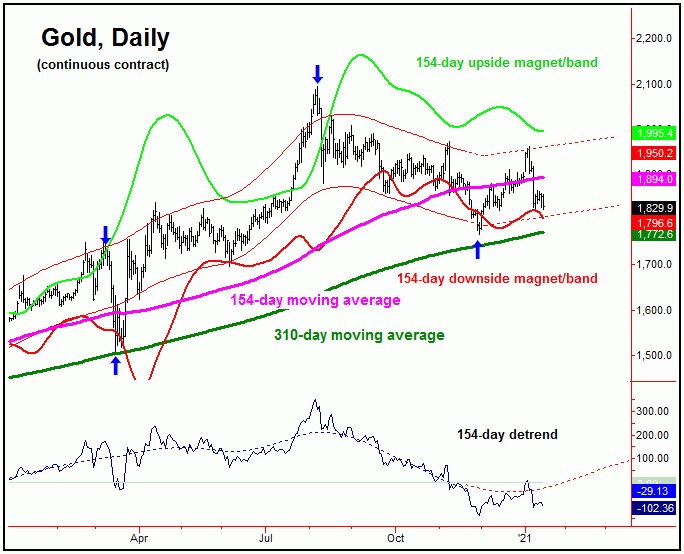
Going further with the above, the next upward phase of the 34-day cycle is favored to take gold back to the upper 154-day cycle band, currently at the 1995 figure (February, 2021 contract) - but which is declining daily, and will obviously be at lower levels by the time we get to mid-to-late February.
For the bigger picture, as mentioned in past outlooks, the action will continue to be choppy, until we can get the next larger low out of the way, with that low expected to come from the bigger 310-day wave - and which is due to materialize into the late-March to mid-April timeframe:
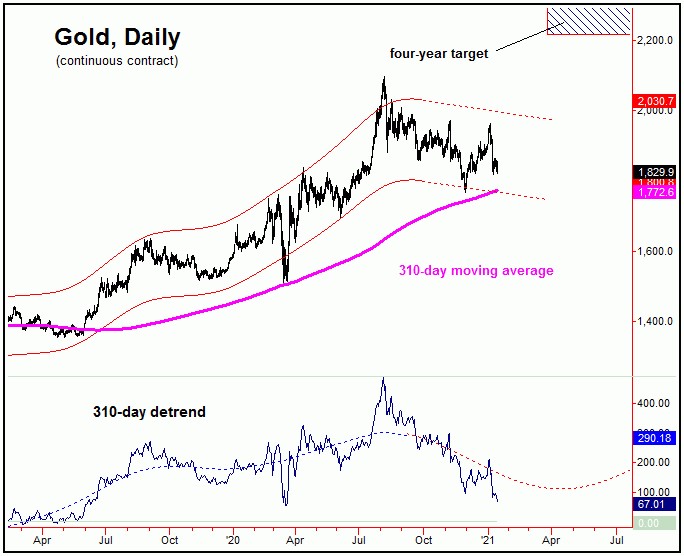
Once the next 310-day trough is set in place, our bigger-picture view is looking for a push into the open upside target from the larger four-year wave, to the 2212.00 - 2340.56 region. At that point, the next larger-degree peak is expected to form, giving way to a good-percentage decline into the late-2022 to early-2023 region.
S&P 500 Bracing for Key Decline
From the comments made in past articles, the larger trend for U.S stocks is seen as pushing higher into the year 2022 or later, due again to the configuration of the four-year time cycle, shown again below:
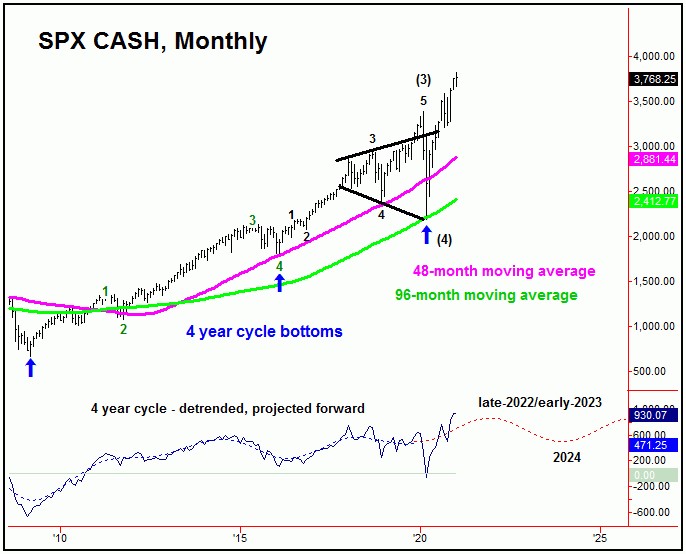
In terms of price, we have considerably higher targets price targets with the four-year wave. Having said that, even with the bigger-picture pointing higher, there will be the normal correction phases along the way - the first of which is due to materialize at anytime.
Potentially, the SPX may have topped with the recent tag of the 3826 figure, though that has yet to be confirmed, with the most current downside confirmation (reversal levels) noted in our daily/weekly Market Turns report. If the recent swing top was not the peak, at least a 'momentum' high likely has formed with the same.
Take a look at the next chart:

The chart above shows our 360-day cycle channel, along with our Mid-Term Breadth index - with the latter shown in the bottom pane. Of key note is that the SPX is currently well extended from the upper (green) channel, with that channel in the low-end 3500's and rising.
What we have found is that, when prices are this extended above the upper channel - and the same is being accompanied by a divergence in our Mid-Term Breadth index (as we are currently seeing), there is a good tendency for price to revert/correct back to the upper cycle channel. We last saw this following the early-September, 2020 peak, which led to a sharp drop back to the upper channel line - before resuming the larger uptrend.
With the above said and noted, we are looking for a decent correction to materialize in the next 4-6 weeks, with the U.S. stock market. However, with the larger trend with the bigger four-year cycle pushing higher into the year 2022 or later, we expect this coming correction phase to end up as a countertrend affair - giving way to higher highs, upon completion. From that high, we are expecting the largest-percentage decline of the year to unfold, playing out into later in the year.
We have recently released our Market Turns 2021 Forecast issue for the U.S. stock market, which includes a detailed analysis of seasonality, the ‘presidential cycle’ and decennial patterns, yearly support and resistance projections, the Armstrong Model, the Bradley indicator - as well as our Time Cycle Forecast's projected path for 2021.
Jim Curry
The Gold Wave Trader
http://goldwavetrader.com/
http://cyclewave.homestead.com/
share
share
share
share
share


