Gold Upside Target - U.S. Stocks Bottoming


Gold once again saw its low for the week made in early-week trading, here doing so with the tag of the 1567.60 figure (April, 2020 contract). From there, strength was seen into a Thursday high of 1595.50 - before backing slightly off the same to end the week, with a decent net gain from the prior Friday.
Gold Up-Cycle into Late-February
For the stepped-back view, the gold market is projected higher into the late-February timeframe or beyond, due to the configuration of the 72 and 154-day cycles. In terms of price, we noted last weekend the 1634-1660 region as a potential magnet into the same, an assessment which has now been confirmed by an upside price projection with these waves to the 1658-1691 level for the April, 2020 contract. Take a look at our first chart:
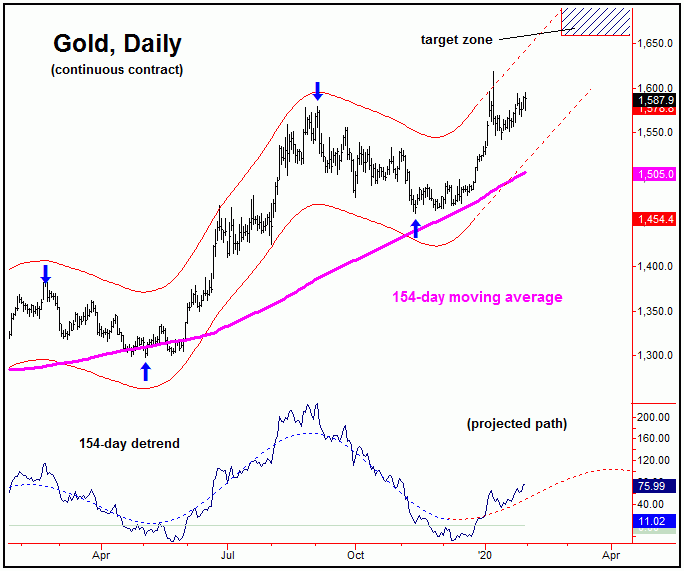
The chart above shows the 154-day time cycle, which confirmed its last low to be the mid-November, 2019 trough of 1458.90 (April, 2020 contract). With the most recent action, this wave has confirmed an upside price target to the 1658-1690 region, with the highest-odds for this range to be hit being the mid-to-late February timeframe. From there, we will be on the lookout for the next correction phase of the smaller 72-day component to take hold.
Gold, Near-Term
With the above said and noted, there is a smaller 34-day cycle, which has been pointing sideways-to-down off the 1/8/20 peak. Here again is that cycle:
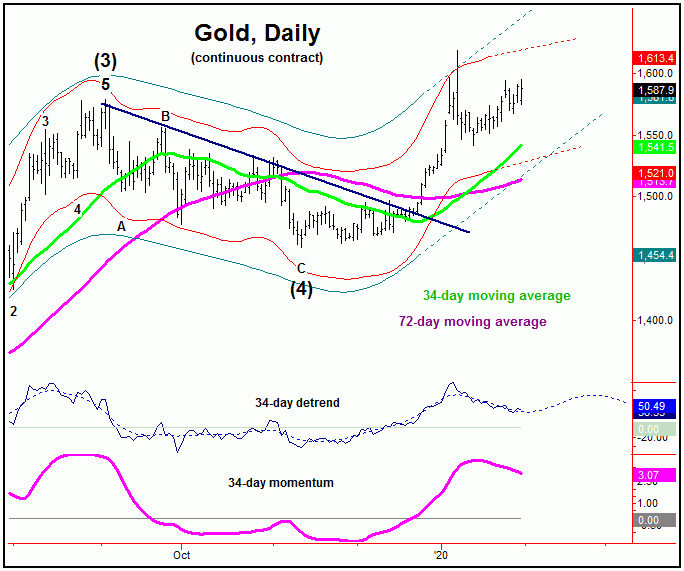
In terms of time, this 34-day wave is next due to trough around the first week of February, a move which is anticipated to end up as countertrend. Normally, a cycle will revert back to a moving average of the same length before bottoming, and with that the ideal path would favor a drop back to the 34-day moving average in the coming week or so, setting up the expected countertrend low for this wave - prior to the favored surge into late-February or beyond.
U.S. Stocks in Early-End Bottoming Window
As pointed out in recent weeks, the U.S. stock market - as measured by the S&P 500 index (or SPX) - was into extended territory with the 45-day cycle, and with that was overdue for a sharp correction off the top.
From my 1/12/20 article: "the (45-day) detrend is projecting lower prices in the days/weeks ahead, an assessment which is confirmed by momentum - which is also rolling over. With that, the minimum downside 'risk' is back to the 35-day moving average, though we see more downside potential than this bare-minimum decline."
As mentioned in prior weeks, the SPX was well into extended range - and with that the drop from the January 22nd peak has come as no real surprise. In terms of price, the overall expectation was that a minimum drop back to the 35-day moving average would be seen on the current correction phase, an assessment which has now been hit with the action seen into early last week. Take a look:
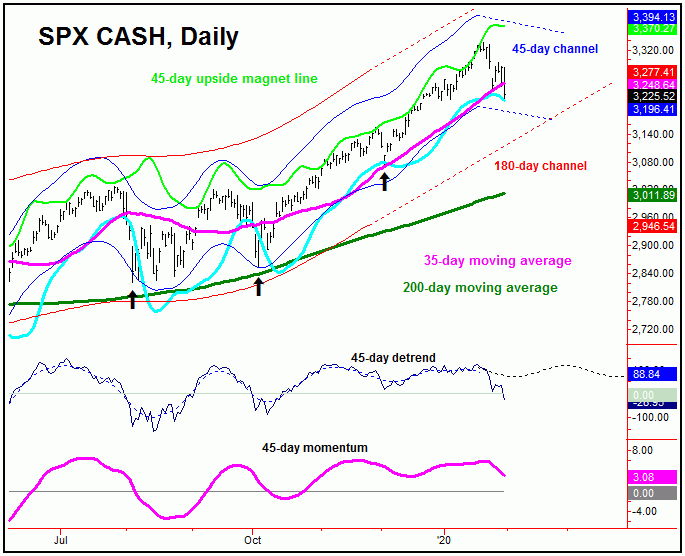
In eyeballing the above chart, we see that both the detrend and momentum indicators are currently pointing south, which favors lower lows are still out there for the move. In terms of price, the next key level for the SPX CASH index is the 3176 figure, plus or minus, which is the 61% retracement of the swing up from the early-December low to the January 22nd peak. This could be one spot to be on the lookout for the next swing low to materialize.
The second thing of mention is that the larger 180-day cycle channel is still trending higher, which favors the current decline phase to end up as an eventual countertrend affair - holding above the early-December trough of 3070.33 on the SPX. If correct, then the probabilities are 80%-or-better that a push back to new all-time highs will be seen on the next 3-6 week upward phase - before working on our next mid-term top, which we think is coming.
For the bigger picture, we have identified the approximate time and price range for the next mid-term top to develop with U.S. stocks. From there, the largest percentage decline of the year is favored to play out, taking stocks down into a key date range that we have also identified in our Market Turns report, which tracks the U.S. stock market.
I am traveling this weekend, and thus my article has to be slightly abbreviated. Good luck into what promises to be a fairly critical week for the markets!
Jim Curry
The Gold Wave Trader
http://goldwavetrader.com/
http://cyclewave.homestead.com/


