Gold (Will You Get Filthy Rich?)


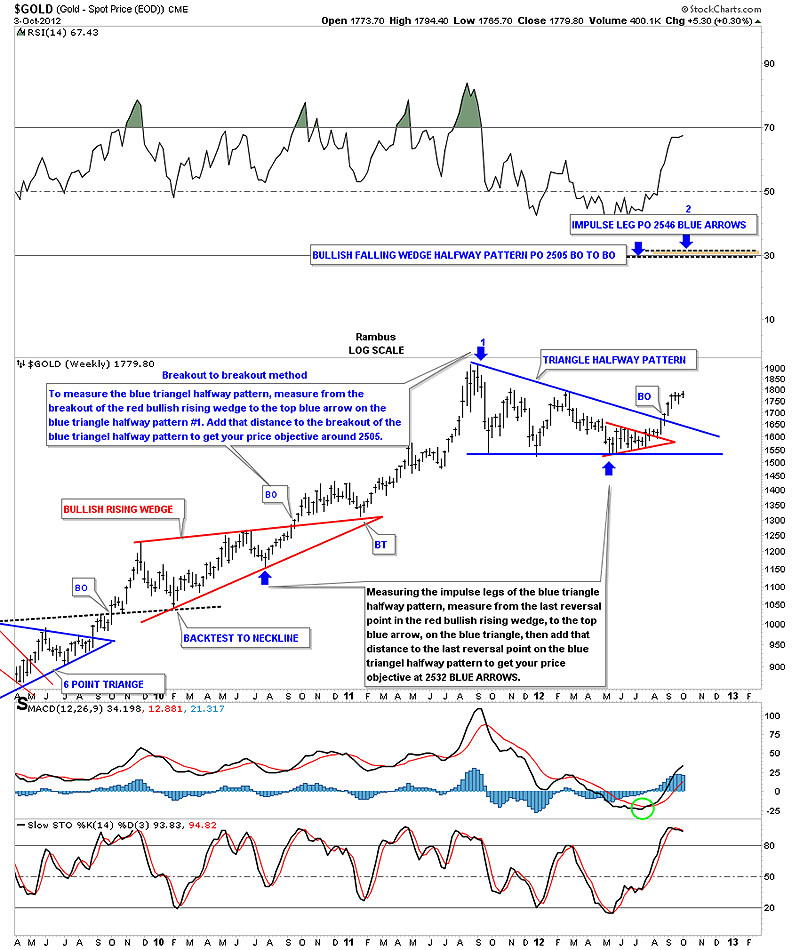
Tonight I want to show you my long term price objective for this next impulse leg higher for gold.This would be of the intermediate term variety. There are two ways I measure for price objectives. The first one is what I call the breakout to breakout method. To get your price objective you have to have two confirmed consolidation patterns in which to make your measurements. With this method I measure from the breakout of the lower consolidation pattern to the top of the current consolidation pattern. In this case the blue arrow with the #1 above it. I use the Fibonacci tool to measure the distance. Then you take that measurement from the breakout of the red bullish rising wedge to the top blue arrow with the #1 above and add that distance to the breakout of the blue triangle, our current consolidation pattern. This method gives us a price objective up to 2505 on the chart below.

Sticking with the same chart above lets look at another way to measure for a price objective. This method measures each impulse leg starting with the lower consolidation pattern, in this case the red bullish rising wedge. I always take the last reversal point in the lower consolidation pattern to start the measurement for the impulse leg, blue arrow. The impulse leg we are measuring starts with the blue arrow at the last reversal point in the red bullish rising wedge to the blue arrow with the number 1 above it. That is an impulse leg. Next, you take that measurement and add it to the last reversal point in the higher consolidation pattern, blue arrow. This method has a price objective up to 2546 for impulse leg #2. As you can see on the chart below that leaves our current blue triangle showing as a halfway pattern forming halfway between the two impulse legs number one and two. The brown shaded area, at the very top of the chart, shows how close these two completely different ways to measure a price objective come out very close together. Note this only a guide as sometimes a stock may go higher or not as high and sometimes they hit the price objective dead on the money. When we get up to the 2500 area I’ll be looking for some exhaustion and some type of reversal pattern such as a double top or H&S top to complete the impulse leg.
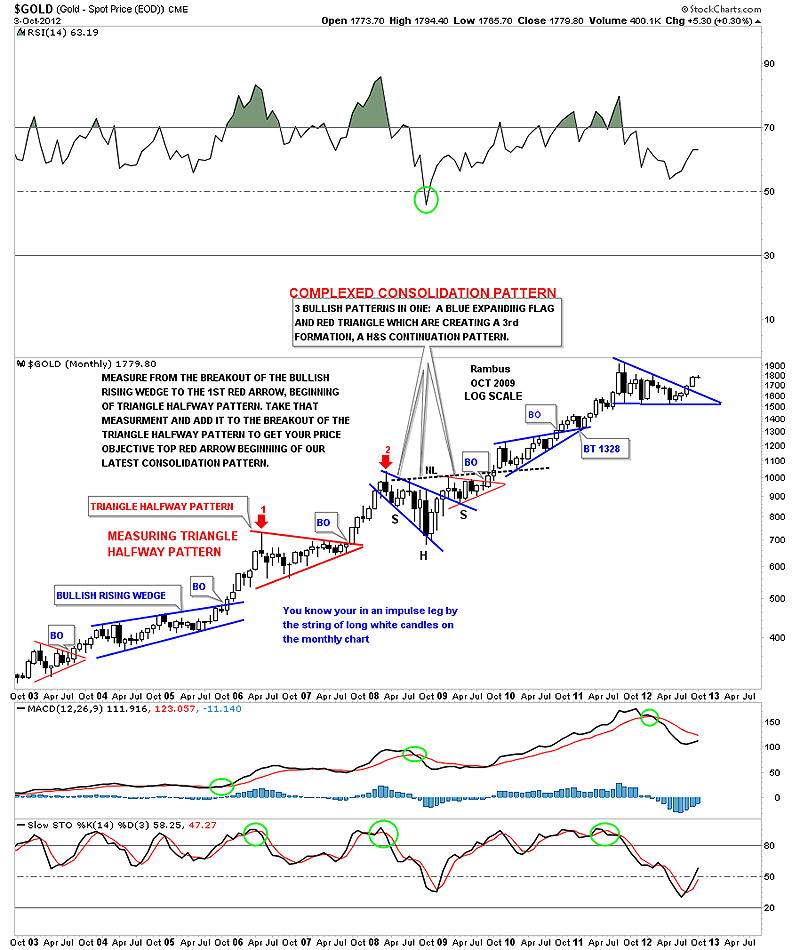
Below is a monthly chart for gold that goes back to 2003. Note the blue bullish rising wedge that formed in 2004 and 2005. I used the breakout to breakout method to nail the price objective for the 2008 high that came in just before the big crash started. The red triangle is your halfway pattern. Just measure from the breakout from the bullish rising wedge to the top of the red triangle halfway pattern, red arrow number one. Take that measurement and add it to the breakout of the red triangle to get your price objective red arrow number two. Note all the white candles for each impulse legs for number one and number two, red arrows.
Once gold breaks out to new all time highs we will have a road map to help guide us through some of the smaller corrections that will show up along the way. If we are in a true impulse leg higher the corrections will be short and sweet but will be painful when your living through them similar to what we’ve been experiencing over the last three weeks. The higher gold goes the harder it will be to stay on the bull as each pullback will affect you emotionally until you can’t take it any longer. You will come up with many good excuses to sell along the way. That’s just the way markets work. If it was easy everybody would be filthy rich which we know that can’t happen in the markets. Only a small percentage of investors become filthy rich. All the best…Rambus
To Subscribe to Rambus Chartology and see Rambus' 10 Favorite PM Stocks and a World of Charts and Projections including the Chartology Forum where Rambus answers your Questions and even Charts your Favorite PM Stocks by Request, go to : www.rambus1.com
 Meet Rambus, a seasoned trader and technical analyst renowned for his unbiased and insightful chart work. Through his website, Rambus Chartology, and Substack newsletter, Rambus shares his expertise with a global community of subscribers, providing daily updates, commentaries, and hands-on training in the art and science of chartology. With his calm, humble, and down-to-earth approach, Rambus demystifies complex market trends, helping his followers navigate the challenges of today's volatile markets. Join the Rambus Chartology community today and discover a unique blend of technical analysis, trading expertise, and time-tested protocols. Subscribe now at www.rambus1.com or https://rambuschartology.substack.com/


