The Gold/Oil Ratio Is An Important Indicator Of The Global Economy’s Health


Because gold and crude oil are both denominated in US dollars, they are strongly linked. That is because as the US dollar rises, commodities priced in USD fall, and vice versa. As the dollar drops, commodities generally go up.
Another important link between gold and oil is inflation. Because energy comprises about one-third of the Consumer Price Index (CPI), when crude oil rises it impacts inflation. Gold being a traditional inflation hedge, it follows that as higher oil prices lead to increased inflation, the gold price goes up, as more investors buy gold to diversify out of inflation-losing assets like bonds and cash.
Gold and oil are further related in that a spike in oil prices dampens economic growth, because so many industries depend on it and its derivatives as a fuel source, i.e., natural gas, gasoline and diesel. (Diesel fuel is a major input for gold mining operations, therefore as fuel costs rise, so does a producer’s costs per ounce, which can lead to lower output. If this happens across the industry, lower gold supply versus demand will hike prices).
A drop in global growth, particularly in the two largest economies, the United States and China, might signal a recession is coming which is almost always bullish for gold prices.
The chart below shows the historical ratio between the gold price and West Texas Intermediate (WTI) crude. Simply put, the gold-oil ratio is how many barrels of oil can be bought with an ounce of gold.
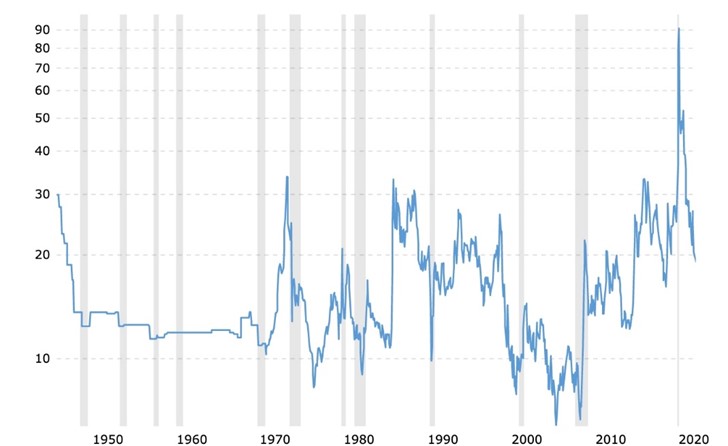
Historical gold to oil ratio. Source: Macrotrends
The next chart by Visual Capitalist indicates that gold is more expensive relative to oil when the gold-oil ratio is above 30. For most of history, the ratio has sat between 10 and 30.

Source: Visual Capitalist
For what’s been happening with the gold-oil ratio recently, it helps to consult the five-year chart below. The ratio spikes to 91 in April 2020, the worst month of the coronavirus pandemic, before recovering about half to 46.62 in May, from which point it continues to fall to the current April 2022 ratio of 19.4. The all-time high of 91 in April 2020 was a combination of plummeting WTI which at that time was $16.80 against a gold price of roughly $1,625. Remember oil usually falls during recessions and gold rises. However the covid-19 recession was extremely short-lived, depicted in the historical gold to oil ratio chart as a very thin gray line. As economies recovered, growth and oil demand surged, thus lowering the ratio. When gold hit its all-time high of $2,034 in August 2020, WTI was still floundering at around $32. It took a more than doubling of WTI over the next 15 months, and gold to fall around $200, for the ratio to revert back to 25, a long way from its historic high of 91 but still higher than its average 16.
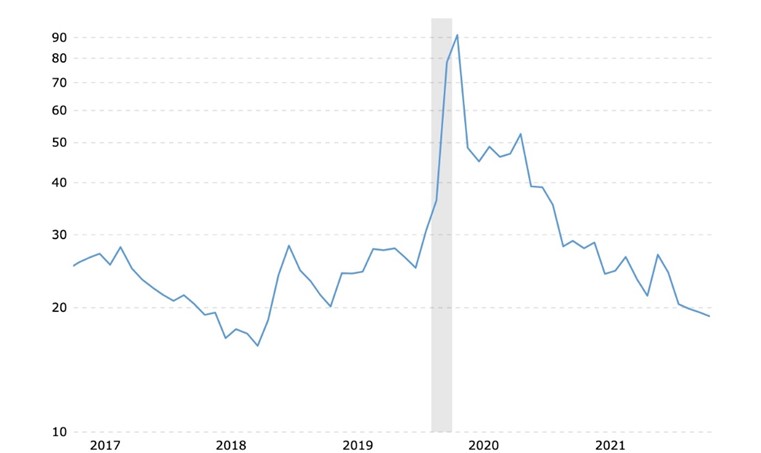
5-year gold to oil ratio. Source: Macrotrends
Logically, if oil prices are dropping while gold prices are climbing, i.e., an above-average gold-oil ratio, it would mean the global economy is in poor health and a recessionary period may be around the corner.
This is clearly something investors would want to know about.
We can also take what we know about the oil and gold markets right now, to try and determine in which direction the ratio is heading. If we think oil prices are heading higher, that would be inflationary for goods that contain petroleum products or need to be shipped long distances using fossil fuels. It also means that companies which depend on oil or natural gas for inputs, such as fertilizer manufacturers and food distribution companies, will see their costs rise and will therefore pass those costs onto their customers. Energy producers obviously make more profits when the prices of oil and natural gas increase, making them a smart investment, as long as energy prices remain elevated.
Anatomy of an energy crisis
We have been told repeatedly that we are in the midst of an energy crisis, that is to a significant extent responsible for the high rates of inflation countries are experiencing.
Inflation in the US hit 8.5% in March, the highest since 1981. The Labor Department said gasoline prices were the main driver behind the jump in the Consumer Price Index (CPI), rising 18.3% in March and accounting for over half of all the items’ monthly increase.
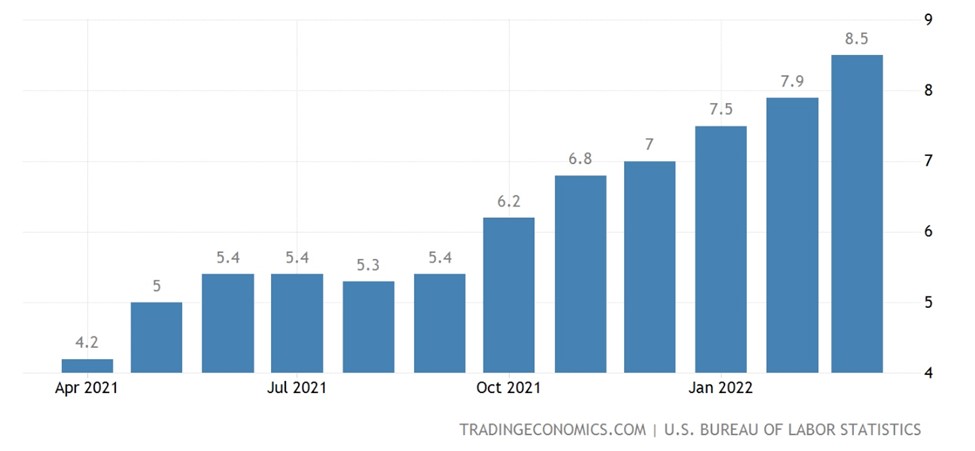
US inflation
If you listen to the news lately, you will be led to believe that high oil and gas prices started with the war in Ukraine. This is false. The price of natural gas was surging well before the invasion in late February, and oil swelled past $80 back in October of last year.
As for why energy markets tightened, and why that won’t abate even if the Russia-Ukraine war ends, Wall Street commodities investment firm Goehring & Rozencwajg (G&R) has some smart ideas.
“What I would point out is that the current crisis in Ukraine is not the cause of high energy prices today,” Adam Rozencwajg, CFA, and G&R managing partner, told Investing News Network. “It’s the catalyst that really forced prices up a lot higher, but we were very, very tight beforehand and we’re going to be very, very tight here after hopefully some of the situations resolve themselves.”
Cast your mind back to the third quarter of 2021. At that time it was the natural gas market, not the oil market, that had slipped into severe deficit, hiking prices.
The price rise was not only due to 2020’s depleted inventories and a cold autumn, but a faster than expected recovery from the pandemic, ultra-low interest rates and record government spending on pandemic relief that boosted spending and increased demand for energy.
By September 2021, NG prices in Europe and Asia reached $32-33 per mmbtu, equivalent to a crude price of $200 per barrel. Electricity prices across Europe set fresh and frightening highs, including in Germany, where it jumped to 431 euros per megawatt-hour.
How did the energy crisis emerge so quickly and unexpectedly? G&R answers by first pointing out that the oil and natural gas markets are closely linked. When natural gas prices began to take off, European utilities switching from burning expensive gas to much cheaper oil, increasing oil demand by over 500,000 barrels a day.
“This additional source of demand has introduced even more tightness into an oil market that is already undersupplied.”
A second factor is what G&R refers to as the “S-Curve”. Think of it as a surge in energy demand. As countries have gotten richer over the past 20 years, their demand for oil has increased. In 1995 the firm estimates about 700 million people were in the midst of their S-Curve, versus almost 4 billion today — the most in history.
This next bit is crucial to understanding what is happening with the energy markets. G&R sums it up as follows:
Coinciding with the explosion of energy-hungry consumers is the misguided focus on renewable energy over the last 10 years. Mounting ESG pressures forced energy companies to significantly reduce their traditional hydrocarbon investment while dramatically increasing commitments to renewable energy projects. Wind and solar have a fundamental problem: they are intermittent and therefore unsuited for baseload power.
We have argued that surging demand from the S-Curve combined with a reduction of traditional energy capital spending would prove unsustainable. The result is the energy crisis unfolding today. We are still in the very early innings of this new cycle.
That was written in the third quarter of last year. We now need to bring you up to speed as to what is happening with the oil market currently.
After hitting nearly $140 a barrel in early March following Russia’s invasion of Ukraine, and topping $120 two weeks ago, crude oil futures have dropped back to just over $100.
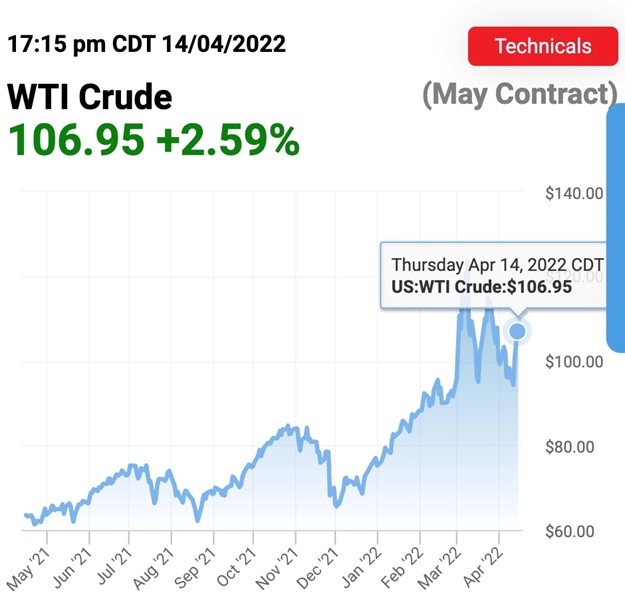
1-year WTI crude
There are mainly two reasons for the price slippage. First is an influx of supply into a tight oil market. Western countries have reportedly committed to unleashing an unprecedented 240 million barrels of oil in storage. The United States alone will release a million barrels a day from the US Strategic Petroleum Reserve, for the next six months.
The second is a reduction in oil consumption resulting, ironically, from high oil prices. As CNN notes, The global economy is catching up to high prices, and investors are getting a case of the butterflies.
For example China’s covid lockdown of Shanghai and other cities means millions of people aren’t driving or flying in the world’s second-largest oil-consuming economy.
Globally, the risk of recession is rising, due to stagflation, a toxic mix of high inflation and low economic growth. For example the British economy grew at only 0.1% in February, as construction and manufacturing went into reverse. Inflation there is simmering at 7%.
Moreover, surging prices are being blamed for protests in a number of countries, including Sri Lanka, Pakistan and Peru. As CNN reports, Pakistan’s parliament ousted Prime Minister Imran Khan from office Sunday after double-digit inflation eroded what little support he had left. At least six people have died in recent anti-government protests in Peru sparked by rising fuel prices.
We remind readers that the Arab Spring started over a shortage of bread. When grain prices spiked, the cost of bread in Egypt rose 37%. Chronic unemployment meant more people depended on subsidized bread, but the government didn’t make any more available. This led to social unrest that eventually unseated Egyptian President Mubarek.
We may be experiencing déjà vu, especially with the war in Ukraine up-ending food shipments from the “breadbasket of Europe”. An estimated 40% of the country’s wheat and corn exports go to the Middle East and Africa, to countries already struggling with food insecurity and hunger.
In 2011, in the run-up to the Arab Spring protests, the United Nations’ Food Price Index hit a then-record 131.9. In March, the index was 159.3, up 13% from February.
Oil prices and recessions
Back to oil, in a previous article we wrote about how high oil prices have historically been correlated to recessions.
Investopedia reveals the common factor throughout nearly all US recessions is oil market turbulence; a sudden increase in the price of crude oil has preceded nine out of 10 post-WWII recessions.
Not surprising, considering our dependence on fossil fuels.
Oil price shocks send ripples through the Canadian and American economies, since both are significant oil producers. For example, at the end of 1998, crude oil was priced at just $11 a barrel. By late 2000, it had tripled to $34/bbl. High oil prices combined with the dot.com crash and Enron, resulted in the 2000-2001 recession.
An oil price shock puts pressure on other prices to increase (like transportation costs), which hikes inflation. Businesses put expansions and hiring on hold, or lay people off. Gradually GDP growth slows, unemployment rises, as does the cost of living. Costs are rising but the dollar is worth less. People have less to invest, or invest more conservatively, moving their money out of stocks and into safe havens like bonds, foreign currencies and precious metals. Sustained selling crushes the stock market. A recession ensues.
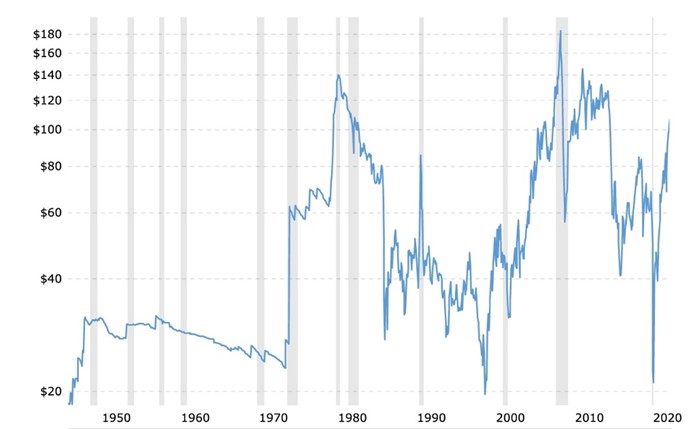
Oil prices, shaded areas are recessions. Source: Macrotrends
Yield curve inversion and oil prices
High oil prices are a good predictor of recessions, but an inverted yield curve is an even more reliable indicator.
In a typical healthy market, yield curve shows lower returns on short-term investments and higher yields on long-term investments. This makes sense, as investors earn more interest for tying up their money for longer. The yield curve is said to “invert” when short-term yields are higher than long-term yields.
All of the post-WWII recessions except two were preceded by an inversion. We also know that nine out of the last 10 recessions saw oil prices spike immediately, or very close before the recession.
As an article in Advisor Perspective reports, this yield curve recession indicator is so reliable, it cannot be argued. Author Erik Conley writes: “I don’t know of any economists who dispute this assertion; history is history and not theory.”
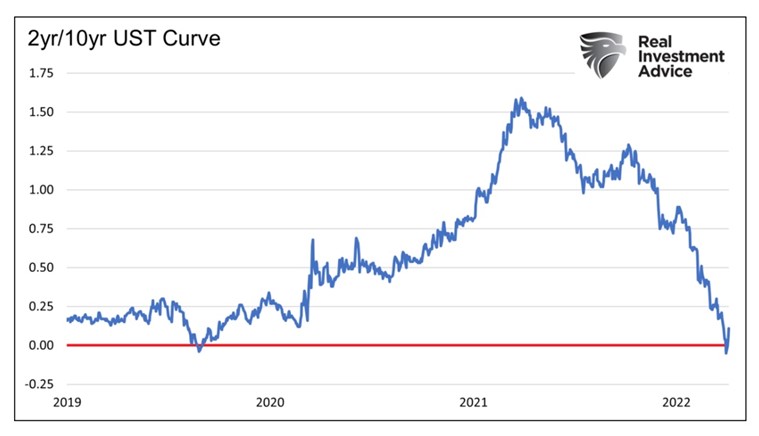
Well guess what? The yield curve is once again inverting, signaling the next recession may not be far off. As the chart below shows, over the past 12 months, the 2 year/ 10-year yield curve has flattened by 150 basis points, coming awfully close to inversion, where the blue line would dip below the red line. A recession typically occurs six to 18 months after the yield curve inverts.
Shortages could be long-lasting
At AOTH, we don’t see energy inflation stopping. Trouble is, we’ve been so focused on expanding renewable energy, before it can actually replace fossil fuels, that we have virtually guaranteed oil (and natural gas) prices will stay high for the foreseeable future.
Saudi Arabia’s Oil Minister, Abdulaziz bin Salman, has warned that falling investment in fossil fuels means that oil production could plummet by 30 million barrels a day by the end of the decade.
But we don’t have to wait that long to see the effects of a tight oil market; the demand for oil has exceeded supply since 2020. As economies recovered from the pandemic, and bought more oil, OPEC countries agreed to the largest production cuts in history, pushing the market into deficit. The demand-supply imbalance has continued into the first quarter of 2022.
Making matters worse, US shale oil producers, stung by years of losses in the dogged pursuit of growth, stuck by their production guidance even as price doubled.
According to Goldmoney, long-term oil prices are beginning to reflect the coming oil shortage. The research firm believes this is the beginning of a multi-year repricing of the entire forward curve:
[T]he short end of the curve is driven by inventories. The long end of the curve is driven by marginal costs of future supply. So why is the market now suddenly pricing in that marginal costs of supply are rising? We think it is a mix of two things. On one hand the market begins to realize that current cost inflation for production is likely not a temporary phenomenon. On the other hand, it dawns to the market that we are going to face supply issues over the coming decade.
Another tailwind for the oil market, is the fact that renewable energy costs are climbing. Reuters reported this week that the prices of wind and solar power in major global markets have increased nearly 30% over the past year, as developers struggle with chaotic supply chains.
UBS slashed its near-term oil forecast by $10 a barrel, but it predicts Brent will bounce back to $115 a barrel by June.
As for other commodities, metal prices remain elevated on global shortages.
Bloomberg reported earlier this month hat inventories across London Metal Exchange warehouses have “dropped to perilously low levels, raising the threat of further spikes in everything from aluminum to zinc.”
Available stockpiles across the six contracts on the LME are at their lowest levels since 1997. Goldman Sachs warned that copper is “sleepwalking towards a stockout” and zinc inventories fell more than 60% in under three weeks, as Trafigura Group purchased large volumes. The sharp drop echoes a similar drawdown in copper last year, when stocks of the red metal plunged to the lowest since 1974.
Many analysts see metals heading higher as shortages on the LME and the wider physical markets deepen.
Another respected investment bank, JPMorgan, says commodities could surge by as much as 40%, explaining that while allocations appear to be above historical averages, they are not overweight, suggesting further upside and investor gains.
Conclusion
Into this environment of what looks to us, to be long-term structural supply shortages of food, energy (oil, natural gas) and metals, we have the US Federal Reserve bound and determined to fight inflation using the “tried and true” method of raising interest rates.
The Fed is expecting to hike short-term rates by 50 basis points at its meeting in May with similar moves expected over the next several months. That could mean a federal funds rate of 2.25% by the end of the year, compared to the current 0.5%. The Fed normally raises rates in 25 basis point increments, so the pace is much faster than usual.
To choke off inflation, the Fed would have to sharply raise rates to the current CPI reading of 8.5%, as well as sell back trillions of dollars worth of bonds it accumulated through recent quantitative easing. This would crash the stock market and trigger a global recession.
Thus it is very unlikely that the Fed or any other central bank will be able to unwind their balance sheets, nor will they be able to raise interest rates to the level required to tackle inflation.
In other words, the rate hikes will be enough to stall the economy but they won’t be enough to stop the inflationary spiral. The most likely effect is stagflation, where low growth resulting from interest rates higher than the economy can handle is combined with crippling inflation that reduces consumer spending. Always remember consumer spending makes up 70% of the US economy so the ability of consumers to borrow and spend should never be messed with.
Consumers are reportedly already feeling the pinch of high inflation, with online spending posting back to back declines for the first time in over a year.
Long-lasting, not transitory inflation (as some have argued this is), it bears repeating, is due to structural supply shortages of several key commodities including oil, copper, nickel, zinc and fertilizer.
The latter is particularly important. Last year the fertilizer market was hit hard due to to extreme weather, plant shutdowns and rising energy costs — in particular natural gas, the main feedstock for nitrogen fertilizer. Tightened supply due to the war between Ukraine and Russia, a major fertilizer producer, pushed fertilizer prices up 43% at the end of March, a new record.
The higher the cost of farming inputs, the more farmers will have to charge the consumer to make up for those payments. Higher prices for custom fertilizer will force farmers to either absorb the higher cost, or make some tough decisions — like using less fertilizer or none at all, which obviously affects your yield. The increased cost of fertilizer forces ranchers to consider whether they can afford to carry their full herd. The price of herbicides has also gone up, so now they must decide whether to spend a lot of money on weed control. When you factor in unpredictable weather conditions during growing season, such as dry spells, extreme wet and forest fires, it seems to be the start of an extremely vicious cycle that threatens to both drive farmers into bankruptcy, and ratchet up the price of food, all the way up the supply chain from farm to table.
Back to the Fed, in a normal environment, raising interest rates crimps demand for goods and services and makes borrowing more expensive. But we are not in a normal environment. The CPI (8.5%) is the highest it’s been in 40 years and Producer Price Inflation is in the double digits.
The inflation was partially caused by money-printing but it’s more than that now. When two of the most important constituents of the CPI, food and fuel, continue to move higher due to chronic structural supply shortages of oil, natural gas, fertilizers and minerals, the Fed doesn’t have a hope of fixing inflation by raising interest rates.
But it doesn’t mean they won’t try. In my opinion the Fed will go hostile, they will raise interest rates to try and crush demand and they will crash the markets. Investors, businesses, and especially, consumers, will be left to deal with the fallout from job losses, higher loan/ mortgage payments, and the suffocating effects of continuing high inflation.
When, not if, that happens, we expect gold prices to begin the next leg up, likely pushing past $2,000 an ounce for the first time since 2020.
Richard (Rick) Mills
aheadoftheherd.com
subscribe to my free newsletter
Legal Notice / Disclaimer
Ahead of the Herd newsletter, aheadoftheherd.com, hereafter known as AOTH.
Please read the entire Disclaimer carefully before you use this website or read the newsletter. If you do not agree to all the AOTH/Richard Mills Disclaimer, do not access/read this website/newsletter/article, or any of its pages. By reading/using this AOTH/Richard Mills website/newsletter/article, and whether you actually read this Disclaimer, you are deemed to have accepted it.
Any AOTH/Richard Mills document is not, and should not be, construed as an offer to sell or the solicitation of an offer to purchase or subscribe for any investment.
AOTH/Richard Mills has based this document on information obtained from sources he believes to be reliable, but which has not been independently verified.
AOTH/Richard Mills makes no guarantee, representation or warranty and accepts no responsibility or liability as to its accuracy or completeness.
Expressions of opinion are those of AOTH/Richard Mills only and are subject to change without notice.
AOTH/Richard Mills assumes no warranty, liability or guarantee for the current relevance, correctness or completeness of any information provided within this Report and will not be held liable for the consequence of reliance upon any opinion or statement contained herein or any omission.
Furthermore, AOTH/Richard Mills assumes no liability for any direct or indirect loss or damage for lost profit, which you may incur as a result of the use and existence of the information provided within this AOTH/Richard Mills Report.
You agree that by reading AOTH/Richard Mills articles, you are acting at your OWN RISK. In no event should AOTH/Richard Mills liable for any direct or indirect trading losses caused by any information contained in AOTH/Richard Mills articles. Information in AOTH/Richard Mills articles is not an offer to sell or a solicitation of an offer to buy any security. AOTH/Richard Mills is not suggesting the transacting of any financial instruments.
Our publications are not a recommendation to buy or sell a security – no information posted on this site is to be considered investment advice or a recommendation to do anything involving finance or money aside from performing your own due diligence and consulting with your personal registered broker/financial advisor.
AOTH/Richard Mills recommends that before investing in any securities, you consult with a professional financial planner or advisor, and that you should conduct a complete and independent investigation before investing in any security after prudent consideration of all pertinent risks. Ahead of the Herd is not a registered broker, dealer, analyst, or advisor. We hold no investment licenses and may not sell, offer to sell, or offer to buy any security.
********
 (Rick) Mills lives with his family on a 160 acre ranch in northern British Columbia. He invests in the resource and biotechnology/pharmaceutical sectors and is the owner of Aheadoftheherd.com. His articles have been published on over 400 websites, including: WallStreetJournal, USAToday, NationalPost, Lewrockwell, MontrealGazette, VancouverSun, CBSnews, HuffingtonPost, Londonthenews, Wealthwire, CalgaryHerald, Forbes, Dallasnews, SGTreport, Vantagewire, Indiatimes, Ninemsn, Ibtimes, Businessweek, HongKongHerald, Moneytalks, SeekingAlpha, BusinessInsider, Investing.com and the Association of Mining Analysts.


