Gold's Down Trend Continues; Except That Price Isn't Going Down


'Tis a no-brainer that "trend" is based on the past whilst "price" is based on the now. Hence the title of this week's missive. Or for you frenzied StateSide sports fanatics out there given all the collegiate basketball hoopla coming to its climax, we could run as well with "Gold's Down Trend is but a Dribble".
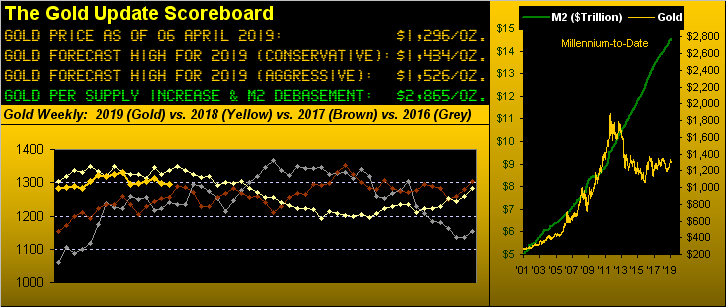
Either way, a glance at Gold's price track year-to-date in the above Scoreboard shows us 'tis all fairly flat throughout: which for the Gold Longs requires their undying patience ... and which for the Gold Shorts requires their chugging Pepto. In fact, let's go straightaway to the next graphic of Gold's weekly bars as a lot is going on therein:

The rightmost area of the chart shows us a sixth red dot of parabolic Short trend locked into place. And yet, look closely. Following the first of the red dots in this series, the second week of the downtrend was actually up; so was the third week; and so again was the fourth week. What kind of down trend is this?
'Course a week ago, we saw those gains hoovered away; yet this past week reaffirmed Gold's firmness, price settling out the week yesterday (Friday) at 1296. Six weeks of parabolic Short trend: but price hasn't even found its way down into The Box (1280-1240) as bounded by the chart's purple lines. Not that it shan't, however recall our piece from 16 February entitled "The Reluctance to Sell Gold"? This wimpy "downtrend" aside, such reluctance remains the case. And here's the really cool bit: see the arrow pointing up at the linear regression trend line? Per what we more recently penned on 09 March: "Barring Gold having a severe fallout, that dashed line in about a month's time ought thus be rising" ... It just happened.
All that said, Gold nonetheless finds itself in Neverland, (aka The Whiny 1290s), wherein it has made a home much too often, indeed from as far back as June 2013. In fact when Gold first reached 1290 on the way up in August 2010, the US money supply as measured by M2 was $8.67 trillion. Then encountering the 1290s in coming back down during 2013, M2 was $10.60 trillion. Now yet again in Neverland for the bazillionth time, M2 is $14.55 trillion. Thus the money supply of foundationless faux fluff is 68% higher than 'twas nine years ago ... and the price of Gold is the same, (its run to 1923 and back notwithstanding), rather than being well beyond 2000. Simply in that +68% construct, Gold right now "ought be" 2167. And of course more precisely as calculated since 1980 for the Scoreboard -- including taking the increase of the Gold supply into account -- Gold right now "ought be" 2865. But you regular readers already know all that, which is why you've got Gold!
Something else that 'twould seem few beyond our regular readers know is the absolutely unimaginable, ever-widening divergence between the rising S&P 500 and the falling Economic Barometer. Bearing in mind that the former is an Index based on stock prices whereas the latter is more oscillative being based on data, revisions thereto, and expectations, we looked back at the interaction between the two since the Econ Baro's inception in 1998. And you know what? This is the largest divergence we've ever seen. And they always resolve to the direction of the Baro. (Which for you WestPalmBeachers down there means the stock market is going to crash). Here's the view from one year ago-to-date:
"But, mmb, the trade deal with China's gonna be terrific..."
And Squire how many times, over and over and over again, does the same news have to be priced into the market? Indeed one for which our "live" price/earnings ratio is up in the stoopidsphere at 31.4x, (Bob Shiller's CAPE is at present 31.1x). Indeed one for which a still-dwindling amount of money is moving the Index. Indeed one for which the yield is 2.003% with no guarantee of getting back the amount which you invest, whilst ten-year money is yielding 2.5% and you know the returned amount of your dough.
'Course when the investing public is led around by the nose with such brilliant financial reporting as (from Barron's yesterday) "The Dow Rose 40 Points Because the Jobs Report Was Strong" even though the 196,000 March payrolls created only met the average of the last six months, what can one expect? (The same dopey reporter wrote on Tuesday that "The Dow Dropped 79 Points Because Walgreens Stock Was a Headache"; we thus presume that Walgreens is of more import to market movement than is job creation). Anyway, you get the point.
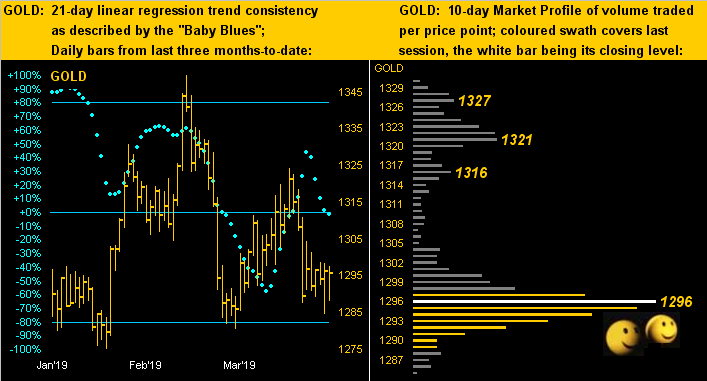
Pointedly speaking as we next turn to the dual-panel graphic of Gold's daily bars from three months ago-to-date on the left and price's 10-day Market Profile on the right, look in the latter at "The Point", aka "1296". In addition to being the week's settle, that is one popularly-traded price there! Support? Resistance? Either way, 'tis The Whiny 1290s on steroids! As for the "Baby Blues" in the opposite panel, their decline -- especially after having not reached up to the +80% level -- is cause for further downside concern, even though "down" through recent days hasn't been down a wit:
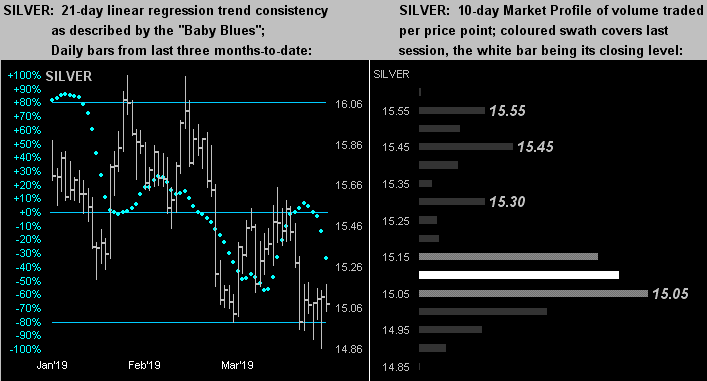
So can the same be said for Sister Silver. Her baby blue dots (at left) are in descent whilst in her Profile (at right) 15.05 is the trading line in the sand:
So with Gold nestled back in Neverland, here's how it appears in the Stack:
The Gold Stack
Gold's Value per Dollar Debasement, (from our opening "Scoreboard"): 2865
Gold’s All-Time High: 1923 (06 September 2011)
The Gateway to 2000: 1900+
Gold’s All-Time Closing High: 1900 (22 August 2011)
The Final Frontier: 1800-1900
The Northern Front: 1750-1800
On Maneuvers: 1579-1750
The Floor: 1466-1579
Le Sous-sol: Sub-1466
Base Camp: 1377
The 1360s Double-Top: (1362 in Sep '17 and 1369 in Apr '18)
2019's High: 1349 (20 February)
The Weekly Parabolic Price to flip Long: 1337
Trading Resistance: 1316 / 1321 / 1327
10-Session “volume-weighted” average price magnet: 1303
Gold Currently: 1296, (expected daily trading range ["EDTR"]: 12 points)
Trading Support: right here at 1296
Neverland: The Whiny 1290s
10-Session directional range: down to 1285 (from 1331) = -46 points or -3.5%
The Box: 1280-1240
The 300-Day Moving Average: 1275 (also the year's low trade price) and falling
2019's Low: 1275 (24 January)
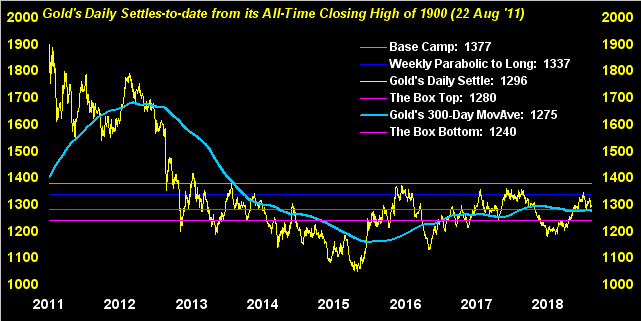
And with respect to those nearby areas in the Stack, here is the graphic of Gold's daily closes from the highest ever-to-date, price today essentially just above the 300-day moving average and for the present protected by both The Whiny 1290s and The Box (1280-1240):
Toward closing, we've these two notes from the "You Can't Make This Stuff Up Dept." as regards goof-ball San Francisco. Mind your hair from standing on end:
■ A friend of ours just bemoaned his car getting towed. Legally parked in its usual spot somewhere in the Mission District, (yes, that same area where high-tech millennials suck on their $100 martinis), he came out to find that his car had vanished. Fortunately, 'twas all caught on a neighbour's video. The tow truck arrived, put up a sign that said "Tow-away Zone" and then took off with the car. Our friend went "online" to find indeed that the City had towed the car. He went to collect it, was told the car was not there, but that the fine was $1,200. Upon asking where the car was, the City didn't know, that it had simply been "moved", and that he'd have to go find it himself, (which fortunately he did). But the fine sticks. Do not move here.
■ As for the $100 martinis bunch, try this. In speaking this past Wednesday with a fellow acquaintance at our local grocery store, he described as having just been at a rather pricey restaurant, again in the Mission District. He said the atmosphere was rather rudely peppered by some loud disrespectful "20-something" Facebook "workers" having a bit too much of a good time at a nearby table. Upon their eventually inebriatedly exiting, our acquaintance talked to their waitress. She said they ran up a bill of $46,000. (We interjected, "You mean $4,600?"). No, $46,000. That included a bottle of wine which the waitress said they'll probably never remember even having been served that cost $12,000. Oh to be back in one twenties in this town, eh? No thanks.
We've got it all here, from fraudulent City tyranny to excessively overpaid child-like buffoons managing the tech world, whilst on downtown streets home is a tent and the curb a bathroom. Monetary disorder run amok. But as a valued reader of The Gold Update reminded us this past week, the erudite James Grant prefers Gold as "an investment in monetary disorder" ... No argument here!

Mark Mead Baillie has had an extensive business career beginning in banking and financial services for two years with Banque Nationale de Paris to corporate research for three years at Barclays Bank and then for six years as an analyst and corporate lender with Société Générale.
For the last 22 years he has expanded his financial expertise by creating his own financial services company, de Meadville International, which comprehensively follows his BEGOS complex of markets (Bond/Euro/Gold/Oil/S&P) and the trading of the futures therein. He is recognized within the financial community of demonstrating creative technical skills that surpass industry standards toward making highly informed market assessments and his work is featured in Merrill Lynch Wealth Management client presentations. He has adapted such skills into becoming the popular author each week of the prolific “The Gold Update” and is known in the financial website community as “mmb” and “deMeadville”.
Mr. Baillie holds a BS in Business from the University of Southern California and an MBA in Finance from Golden Gate University.


