Gold's Next Key Market Top Approaches


With the action seen into last week, gold saw its high made in Monday's session, here doing so with the tag of the 1775.80 figure. From there, a sharp decline was seen into Thursday with the metal dropping all the way down to a low of 1715.30 - before bouncing off the same into late-day Friday.
Gold Market, Short-Term
As mentioned in past weeks, gold was expected to see a series of correction phases, with the last one of significance coming from the 34-day cycle, shown again below:
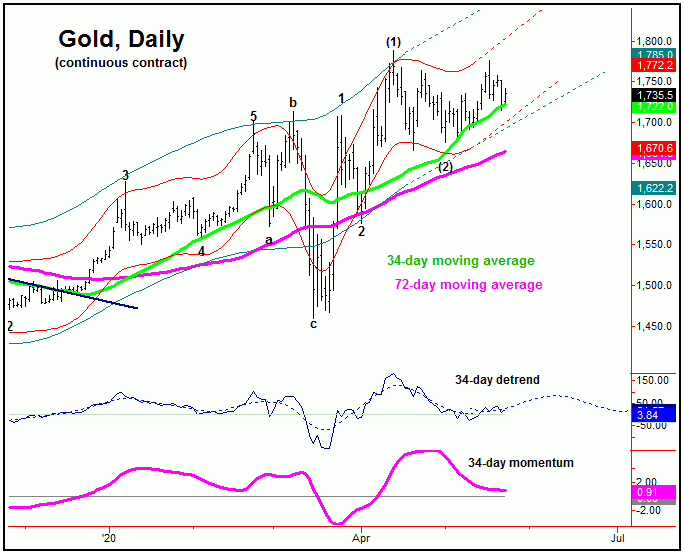
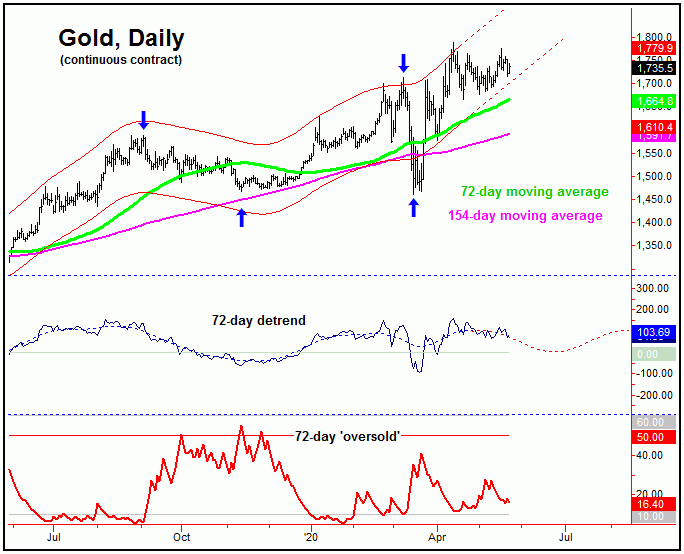
Our 34-day cycle last bottomed with the May 1st tag of the 1676.00 figure (June, 2020 contract), and with that is currently viewed as heading higher off the same - until proven to the contrary. The current upward phase of this wave has been expected to set up the next key price peak for gold, coming from the larger 72-day wave, shown on our next chart:
In terms of price, last Monday's spike up to the 1775.60 figure actually met any minimum expectation for the rally phase of the 34-day cycle. Having said that, with our detrend projecting additional strength in the coming days, we would favor the decline off the 1775.60 swing top to end up as a countertrend affair - ideally holding above our extrapolated 34 and 72-day channel bottoms.
Stepping back then, if the recent decline does end up as a countertrend affair, then the next move up will be the technical setup for our next semi-important peak, once again coming from the larger 72-day cycle. Once that peak is in place, we will be looking for a multi-week correction, which should be significant - but one which we expected to end up as an eventual countertrend affair, within a larger bull market in gold. Going further, the decline into the next 72-day trough should offer up the last really good buying opportunity for the metal, prior to the next larger-degree rally phase, one which plays out into what looks to be later this year.
With the above said and noted, we are moving into the next 'kill zone' for gold - one which should set up the next peak of significance. A 'kill zone' is an approximate price and time region, one where we would expect the current trend to reverse, with more precise details spelled out in our thrice-weekly Gold Wave Trader market report.
As for technicals, take a look at our next chart:
Gold's Technical Configuration
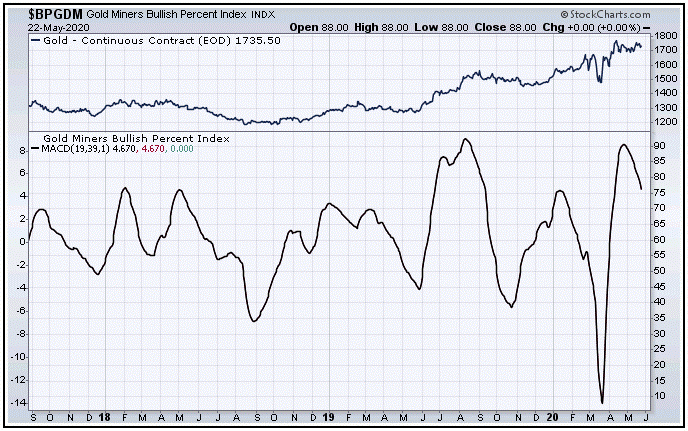
In looking at technical action again this weekend, of note is that our Mid-Term Breadth index for gold - which is an indicator constructed from the gold miners bullish percentage index - is currently pointing lower. From the comments made in recent articles, the position of this indicator is viewed as a technical negative going forward, and with that supports the idea of a key market top approaching for the metal.
Gold's Bigger Picture Assessment
For the bigger picture, even with the bearish cycle (and technical) indications for the coming weeks, as mentioned we are expecting the next correction phase of the 72-day wave to end up as a countertrend affair - though this only means that the metal should not violate the mid-March trough of 1466.00.
If the above is correct, then the stepped-back view has the larger-degree 154 and 310-day cycles pushing higher into later this year, where we will be on the lookout for the next longer-term peak to form - one again with exact details of how this should play out noted in our market report. In terms of price, however, we are expecting gold to move up to the 2000 figure or better, before this next larger peak attempts to form.
U.S. Stock Market Update
From my comments made in recent articles, the last correction of significance was expected to come from our 45-day cycle in stocks, with that cycle shown again on the chart below:
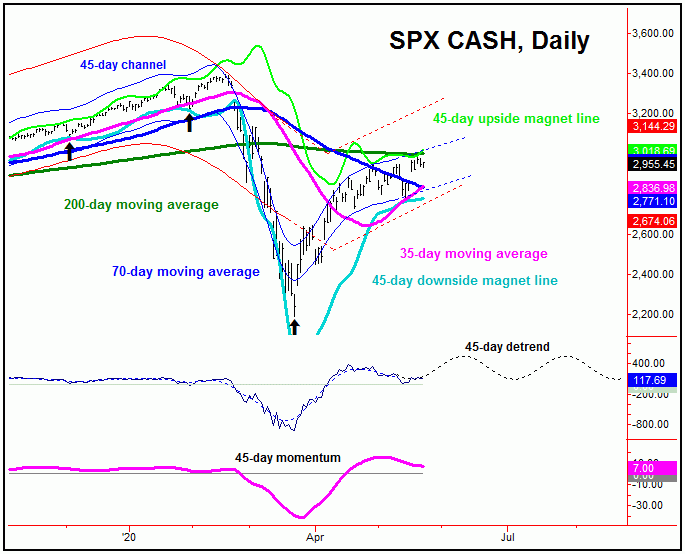
In terms of time, this 45-day time cycle was projected to trough around the mid-May period, with the 35-day moving average acting as the expected magnet to that decline. With that, we were able to scale into a small long position in the SPY (i.e., S&P 500 tracking stock/ETF) right at that key moving average - a position we continue to hold, but will be looking to exit in the days ahead, depending on the action.
In terms of patterns, we projected the recent correction phase of the 45-day cycle to end up as a countertrend affair - giving way to new highs above 2954.86 SPX CASH, on completion. We did get that with the rally seen into early last week, and thus any minimum expectation for the upward phase of our 45-day cycle has already been met.
Having said the above, since we are only 6 trading days along in the current upward phase of this 45-day component, there is the decent potential for additional strength in the near-term, though we are expecting the current upward phase of this wave to set up the next semi-important peak for U.S. stocks, a peak which should come from the cycle shown on the chart below:
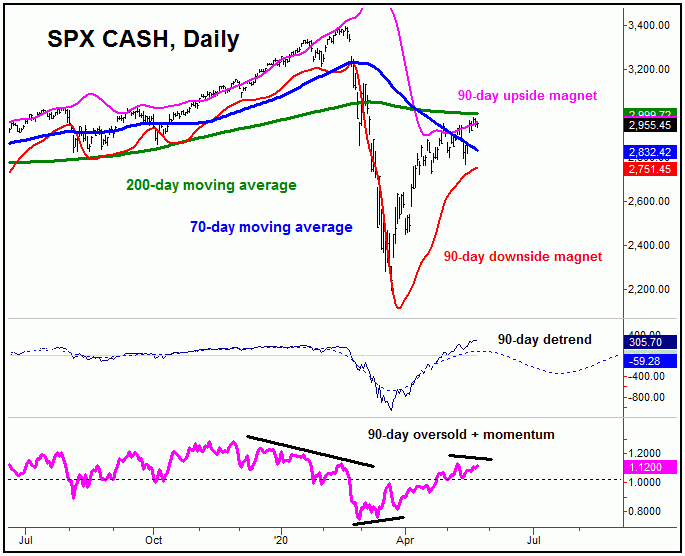
The chart above shows our 90-day wave, which - as can be seen by our detrend - is moving into topping range, and should peak with the smaller 45-day wave going forward. In terms of price, though it is still too early to project where the next high for the 45 and 90-day cycles will be made, there is first key resistance around the 200-day moving average - around the round-3000 SPX CASH figure. The next key level above that, should it be attempted, will be the 3080-3100 region.
Regardless of what price level tops the 45 and 90-day cycles, what follows should be the second largest percentage decline of the year, ideally playing out into the Summer months. However, until proven otherwise, we are now expecting that decline to end up as countertrend - against the late-March bottom. If correct, a push back to or above the highs can be seen into later in the year, before forming a much more significant price peak - inside of what is still viewed as a bigger bear market phase.
The Bottom Line
The bottom line with that above is that Gold is still viewed as heading higher with the 34-day cycle, though the technical configuration of the market suggests a key market peak is approaching. From that high, we expect a larger-percentage drop, eventually bottoming our 72-day cycle - in what is favored to be a countertrend affair. As for the U.S. stock market, the current rally phase is also expected to set up a key market top in the days/weeks ahead, one which should give way to the second largest percentage decline of the year into the Summer months. Stay tuned.
Jim Curry
The Gold Wave Trader
http://goldwavetrader.com/
http://cyclewave.homestead.com/


