Gold's Up Phase In Full Force - US Stocks Topping


Gold started off the new year with a resounding bang - with the metal forming its low for the week in Monday's session, doing so with the tag of the 1513.50 figure. From there, a slingshot to the upside was seen into late-week, here running all the way up to a Friday high of 1556.60 - also ending the week right at the highs for the move.
Gold's 72-Day Cycle
From the comments made in my past articles, the last low of significance came from the 72-day cycle, which is shown again on the chart below:
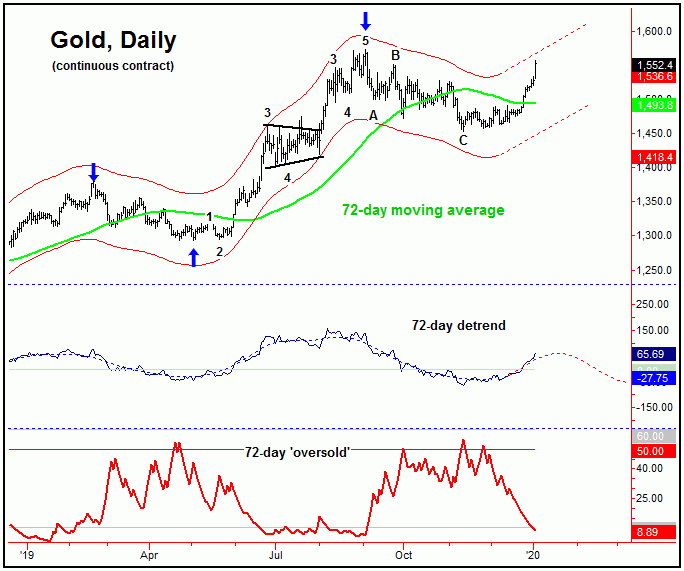
Back in early-December I mentioned the key level for this 72-day cycle as the 1490.00 figure (February, 2020 contract). In other words, reversing above that number, if and when seen, would be our top indication that this wave had made a turn higher - and that its next upward phase would be back in force, ideally pushing higher into the mid-January, 2020 timeframe or later.
In terms of price, the low-end expectation was for the upward phase of this 72-day cycle to take prices up to the 50-61% retracement zone, which has easily been met with the action into last week. Having said that, with the upward phase of this wave now firmly in force, higher highs should be favored in the coming weeks, before setting up the next top for this component.
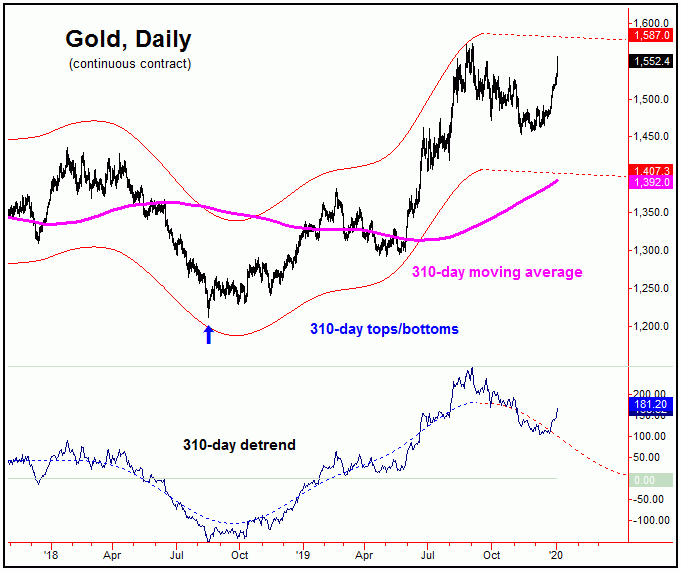
With the current configuration of the 72-day cycle, the probabilities favor any short- term decline phases to end up as countertrend, to be followed by higher highs into mid-January or later. On or after that point, we will have to be looking for indications of the next important peak to form. From that high, another decent decline phase is expected to play out into early-Spring, where our larger 310-day component (shown on the chart above) is next projected to trough.
For the bigger picture, we are expecting the next downward phase of the 310-day cycle to end up as a larger countertrend affair, to be followed by higher highs into the latter part of 2020 - then to set up the next major top with gold. The exact details of how this should play out spelled out in our Gold Wave Trader market report.
Gold Sentiment
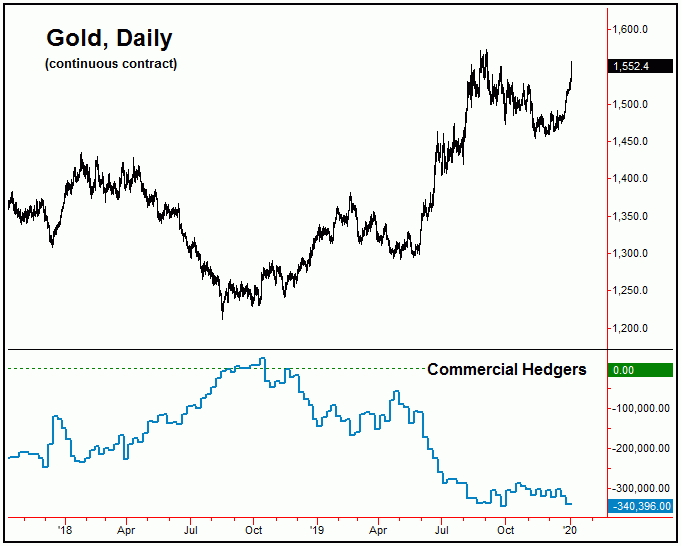
In looking at the most recent numbers from the CFTC, the commercial hedgers (chart, above) have been scaling back into the short side in past weeks, and are now net short some 340,396 contracts - with the data current to the December 24, 2019 close. As mentioned in prior months, I view the net shorts held by the hedgers as a larger bearish indication for gold. Having said that, I don't actually base my ETF trades on what the commercials are doing, but instead use them as supporting evidence to the overall outlook.
With the above said and noted, I see the position of the commercials as adding weight to the downward phase of the 310-day cycle, though - for the coming weeks - the upward phase of the smaller 72-day cycle has to play itself out. As more of a side note, though never managing to catch every bottom and top, we managed to close nearly 100% of our Gold ETF trades with a profit.
U.S. Stock Market (Update)
The title of one of my articles from back in December was that 'stocks were melting up into January', with the potential for the SPX CASH index to push up to the 3250's or better. We have obviously seen that with the action into early last week, and with that stocks are now topping once again - potentially having already peaked with last week's tag of the 3257 figure.
Having said that, this can't yet be confirmed, and with that there is still the potential for a spike back to or above the same before the next correction phase takes hold. Take a look at our next chart, shown below:
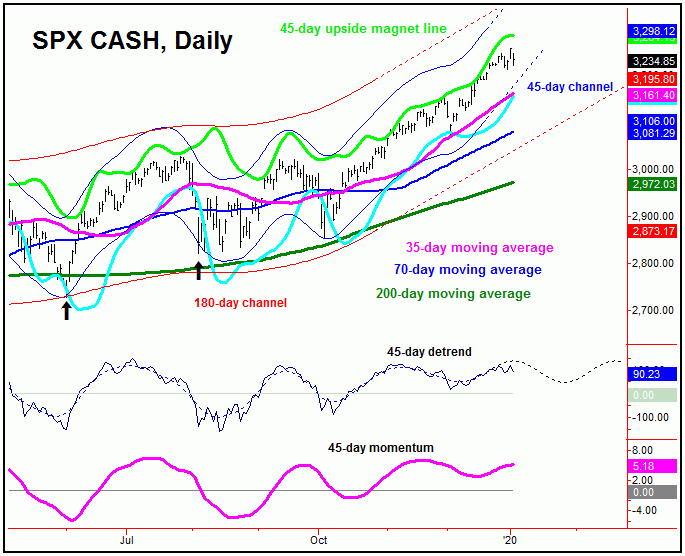
The last important bottom for stocks was registered back in December, doing so with the tag of the 3070.33 SPX CASH figure. That number is a key dividing line going forward, as bull markets will want to remain above December lows. That bottom came as a result of the most dominant cycle in stocks, our 45-day wave, shown above.
Stepping back slightly, as mentioned earlier the next swing top is due to materialize at anytime, with the upward phase of this 45-day cycle having been projected higher into this early-to-mid January, 2020 timeframe. With that, the downside risk is now very high for the U.S. stock market, with the upside potential now seen as limited - the exact reverse situation of where stocks were just one month ago.
With the above said and noted, the 35-day moving average should start acting as the minimum price magnet in the coming weeks, though that move is favored to remain above the early-December trough. From whatever bottom that forms with this 45-day wave, another rally phase is expected to play out into early-Spring, before a more significant correction takes hold.
Stock Market Sentiment
In looking at sentiment with U.S. stocks, the commercial hedgers have added in approximately 12,000 new shorts with the recent action, which puts their current net short total at some 15,531 contracts - with the data current to the December 24, 2019 close. I now view this as a decent bearish indication going forward - and should support the idea of a correction playing out with the 45 cycle in the coming weeks.
The bottom line with the above is that gold should be headed to higher highs into at least mid-January, then to be on the lookout for technical indications of the next peak with the 72-day cycle. As for U.S. stocks, we are at or into topping range, with that top expected to come from the 45-day time cycle - with the downside risk now elevated for a sharp correction. That correction should be the largest - percentage-wise - since the decline into the early-December bottom, though it is expected to end up as a countertrend affair, against the larger bull market trend. Stay tuned.
Jim Curry
The Gold Wave Trader
http://goldwavetrader.com/
http://cyclewave.homestead.com/


