Gold's Third Attempt to Take The Northern Front (1750-1800)


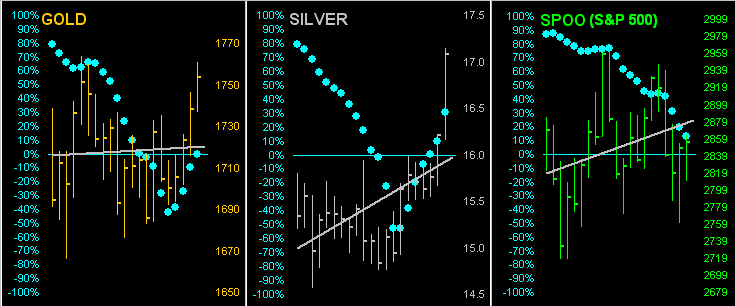
So much for "Gold's Near-Term Trend Turns Negative", the title of last week's missive, proving once again that price moves ahead of that which technical analysis later behooves. Below in the left-hand panel across Gold's last 21 trading days we see the grey diagonal trend line having rotated (albeit barely) back to sporting a positive slope. 'Course the Star of the Show is Sister Silver in the center panel, the white metal at long last regaining at least a little of the massive ground it has lost to the yellow metal in recent years. The Gold/Silver ratio today stands at 102.7x, the millennium-to-date average now 65.7x: the last date on which the ratio was below its evolving average was better than seven years ago on 08 November 2013. The S&P 500's trend in the right-hand panel is also up: but across the graphic, the baby blue dots of trend consistency are rising for the precious metals whilst falling for the stock market:
Price of course being the truth (whereas change is the illusion), let's assess The Now. In settling out the week yesterday (Friday) at 1754, Gold has returned to battle the forces of resistance within The Northern Front (1750-1800). 'Tis Gold's third attempt to take this critical -- and to date repelling -- zone since first crossing its threshold (in this year) back on 06 April, the prior two attempts failing as follows:
■ 06 April: Gold crosses above 1750 for three days in reaching the year-to-date high of 1789 before succumbing to 1662 come 21 April;
■ 23 April: Gold crosses above 1750 for two days before succumbing to 1676 come 01 May;
The duration of this third attempt is thus far one day.
"But mmb, maybe finally it really is different this time......"
Honestly, Squire, we're beginning to think that if it ain't different this time, then it ain't never gonna be different. We in the pro-Gold crowd shall be self-protectively admitted to the Asylum of the Insane for repetitively expecting the same thing time and again as it never occurs.
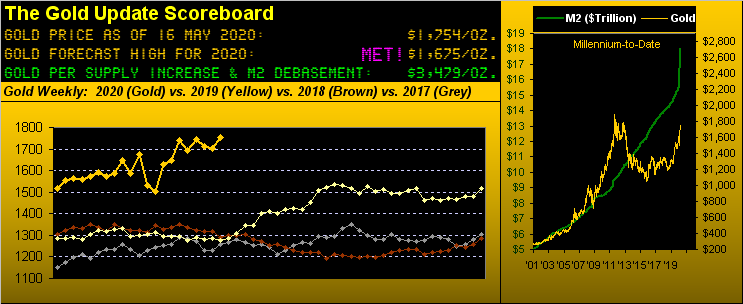
Indeed a piece ran this past week entitled "US$ 3,000 gold likely by year-end". Why must we wait for year-end? Our opening Gold Scoreboard shows price "ought be" 3479 right now, (the debasement data first equating to crossing above 3000 back in January). And yet Gold's price today at 1754 is but half that level.
"Still mmb, it doubled in only 28 trading days from 433 on Dec 7 '79 to 873 on Jan 21 '80!"
And forty years ago that was, Squire. Gold was being traded amongst those sweatily jumping about, shouting into bulky telephone receivers, and sending codified telexes. How thin it was!
Today's electronic markets are far thicker, and lest we forget: every willing buyer must surrender to that offered by every willing seller, many of whom (if the human minority) or of which (if the algorithmic majority) represent the resistance across The Northern Front (1750-1800). To again quote Thelma Ritter from "Boeing, Boeing" --[Paramount, '65]: "It ain't easy ya know..."
Nonetheless 'tis easy to see in the weekly bars chart Gold's ability to stay of late above the dashed diagonal trend line, the parabolic blue dots of ascending trend also continuing their upward glide. But obviously for price itself, these last five weeks have been fraught with to-and-fro ad nauseo. Do we get to scale this chart in a week's time up another 50 points to 1850? Overhead resistance notwithstanding, Gold looks poised for a try should the balance of forces not choose to sell high, but rather to buy:

Meanwhile other battles against resistance continue to ensue. StateSide we've the Executive Branch pro-zero interest rate stance versus the Federal Reserve Bank pro-fiscal spending chance. We've some States turning on their "back-to-work tax revenue taps" versus others lingering in the "stay-at-home under our control" limelight. We've another $3 trillion coming from the House to result in $0 trillion at the Senate. And all of it mixed into the stew finds the Economic Barometer continuing to go down the loo, (but hopefully not taking you):
Moreover as some 70% of the economy is driven by the consumer of whom (according to the JP Morgan Chase customer base) 40% spent less on their credit cards from March into April really highlights the past eight weeks of first time Jobless Claims summing now to 36,180,000. Given the pre-COVID U.S. workforce as of February was 164,600,000, that equates to 22% having been terminated temporarily if not permanently. Cue the career change! We 'spect that, just as (per the above chart) markets fall faster than do they rise, the same phenomena shall arise by the slower rate at which folks find work after having lost it. Thus again our notion of a "vee" recovery with a right-leaning skew.
Elsewhere, across the pond in Europe, Germany as the biggest points scorer saw its Gross Domestic Product revert to -2.2% annualized shrinkage for Q1. And by the Baro above, be it for any of the world's large, industrialized nations, their Q2 GDPs are gonna be ugly!
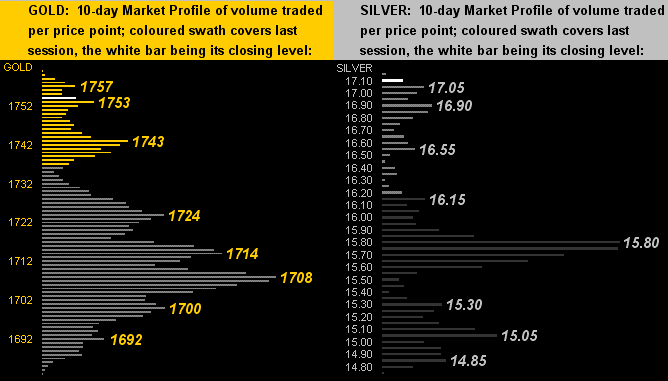
But from ugly to pretty go the Precious Metals' 10-day Market Profiles, replete with many-a-trading volume apex as denoted for Gold on the left and Silver on the right. The two-week gains from low-to-high are: Gold (1683-1761) +4.6%, and Silver (14.76-17.15) +16.2%. Throw in a li'l (understatement) equities leverage comparison and we find across just the same fortnight that GDX (the VanEck Vectors Gold Miners exchange-traded fund) grew +47.6%, AEM (Agnico Eagle Mines) +54%, and even the once terribly-lagging PAAS (Pan American Silver) +53.4%. We told ya Sister Silver was way behind! Still is!!
But not to be left behind whatsoever is The Gold Stack:
The Gold Stack
Gold's Value per Dollar Debasement, (from our opening "Scoreboard"): 3479
Gold’s All-Time High: 1923 (06 September 2011)
The Gateway to 2000: 1900+
Gold’s All-Time Closing High: 1900 (22 August 2011)
The Final Frontier: 1800-1900
2020's High: 1789 (14 April)
10-Session directional range: up to 1761 (from 1683) = +78 points or +4.6%
Trading Resistance: 1757
Gold Currently: 1754, (expected daily trading range ["EDTR"]: 31 points)
Trading Support: 1753 / 1743 / 1724 / 1714 / 1708 / 1700 / 1692
The Northern Front: 1750-1800
10-Session “volume-weighted” average price magnet: 1716
On Maneuvers: 1579-1750
The Weekly Parabolic Price to flip Short: 1553
The 300-Day Moving Average: 1484 and rising
The Floor: 1466-1579
Le Sous-sol: Sub-1466
The Support Shelf : 1454-1434
2020's Low: 1451 (16 March)
Base Camp: 1377
The 1360s Double-Top: 1369 in Apr '18 preceded by 1362 in Sep '17
Neverland: The Whiny 1290s
The Box: 1280-1240
Toward closing, the once-informative now-narrative Wall Street Journal reported this past week that "Market Volatility Recedes to Lowest Level Since February." 'Course you already have known that, however we welcome them aboard, given they, too, must clearly been viewing our Market Ranges page:
Such overall range narrowance is occurring in spite of Goldman Sachs finding that -- on earnings days -- stock prices' moves are the vastest in better than a decade. That seems to support what we'd read the week prior about gamblers having turned from closed casinos to open markets. As for Q1 Earnings Season itself (which we'll give one more week to run), of the S&P 500's 425 constituents having reported, delightfully 65% have beaten the broker's marketing tool known as "estimates" ... yet only 47% have actually bettered their bottom lines from the like period a year ago. And the more dire Q2 awaits in the wings.
As for Gold's third attempt this year -- indeed in just the last six weeks -- to battle up across The Northern Front (1750-1800), you know what they say: three's a charm!
www.deMeadville.com
www.TheGoldUpdate.com
**********

Mark Mead Baillie has had an extensive business career beginning in banking and financial services for two years with Banque Nationale de Paris to corporate research for three years at Barclays Bank and then for six years as an analyst and corporate lender with Société Générale.
For the last 22 years he has expanded his financial expertise by creating his own financial services company, de Meadville International, which comprehensively follows his BEGOS complex of markets (Bond/Euro/Gold/Oil/S&P) and the trading of the futures therein. He is recognized within the financial community of demonstrating creative technical skills that surpass industry standards toward making highly informed market assessments and his work is featured in Merrill Lynch Wealth Management client presentations. He has adapted such skills into becoming the popular author each week of the prolific “The Gold Update” and is known in the financial website community as “mmb” and “deMeadville”.
Mr. Baillie holds a BS in Business from the University of Southern California and an MBA in Finance from Golden Gate University.
More from Gold-Eagle


