Gold's Upward Phase Back In Force


Last week's trading saw gold once again forming its low in Monday's session, here doing so with the tag of the 1706.20 figure. From there, a slingshot higher was seen into late-week, with the metal running all the way up to a Friday peak of 1760.90.
June Cycle Bottom Confirmed
From the comments made in prior articles, the next low of significance was expected to come from our 72-day time cycle, with a particular focus on the mid-June region to trough this component. Here again is that 72-day wave:
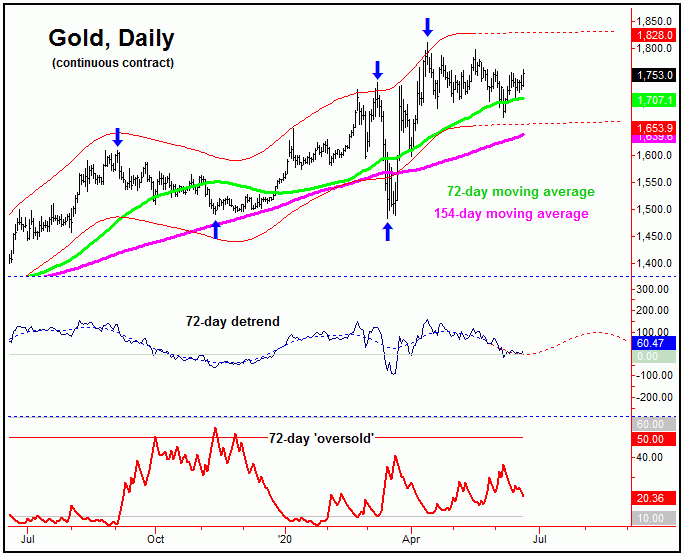
With the overall indications in regards to momentum, I pointed out in our Gold Wave Trader market report that the 34 and 72-day waves had likely bottomed out - and with that were headed higher in the coming weeks, before forming the next good cycle top.
In terms of time, though our bottom was due around mid-June (and made in the first week of June) an earlier-than-expected trough is not out of line for these two waves, which do have a plus or minus variance of around 20% in either direction.
The bad news with the above is that our 72-day 'oversold' indicator was never able to spike above its upper reference line, which we like to see as this wave bottoms. Either way, this cycle is now deemed to be heading higher well into the month of July or later, with the ideal path now favoring new highs for the bigger swing up. If the above assessment is correct, then any minor dips should now look to be bought, in the anticipation of additional strength in the coming weeks.
Gold's Bigger Picture
From the comments made in past months, the bigger picture action was decisively weighted to the bullish side, due to the configuration of our largest-tracked wave, the four-year cycle in gold - which is shown again below:
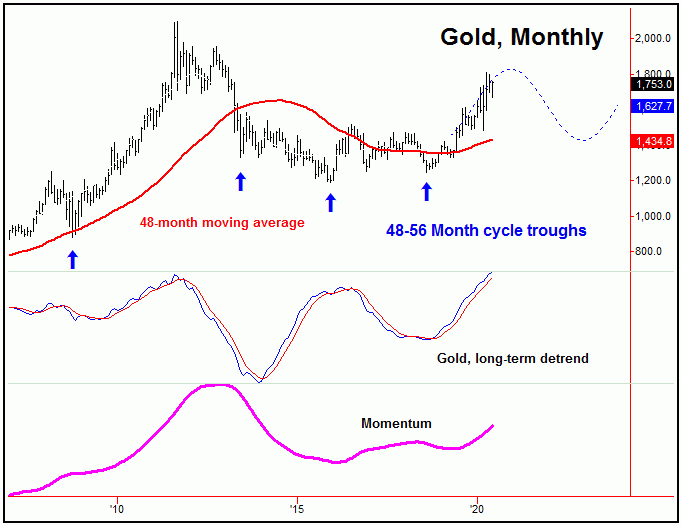
The last low for our four-year cycle in gold was registered back in August of 2018, and with that it is currently pushing higher, an assessment which is confirmed by the action in both our detrend and momentum indicators. In terms of time, the current upward phase of this wave is expected to remain intact well into later this year. Once it does top, however, a correction back to the 48-month moving average is expected to materialize in the months to follow.
In terms of price, as mentioned many times in past months, our expectation is that gold will eventually push up to the round-2000 figure going forward, ideally made on or before our four-year cycle attempts to peak. In-between now and when the four-year cycle tops, there should be one last correction phase to buy, ideally coming around the month of August, plus or minus, and made with the smaller 154-day wave that we track. In terms of patterns, that move should end up as yet another countertrend affair, giving way to higher highs, upon completion.
U.S. Stock Market
In looking at the U.S. stock market this weekend - as measured by the S&P 500 index (or 'SPX') - we recently confirmed a peak in place with the 45 and 90-day time cycles, with the smaller 45-day wave shown on the chart below:
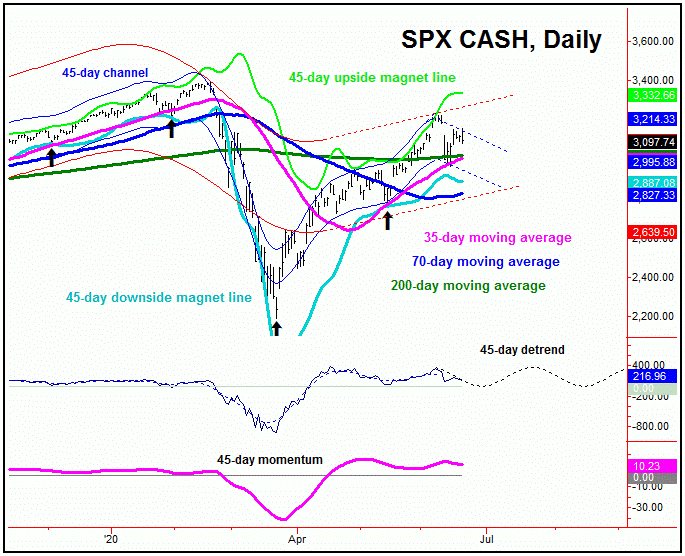
In terms of time, the peak for the combination of 45 and 90-day cycles was due around the mid-June timeframe, with the actual high coming in on 6/8/20, doing so with the tag of the 3233.13 SPX CASH figure. As can be seen on our chart, both the detrend and momentum indicators that track this wave are currently pointing south, and with that we are looking for additional correction in the days/weeks ahead.
Going further with the above, the next low of significance should come from the bottoming of the 45 and 90-day cycles, with the mid-May trough being the last low for the smaller 45-day component. In terms of price, our ideal path would see the low-to-mid 2800's on the SPX acting as a magnet going forward, though the move down is expected to end up as an eventual countertrend affair, due to the position of the larger 180-day cycle, shown below:
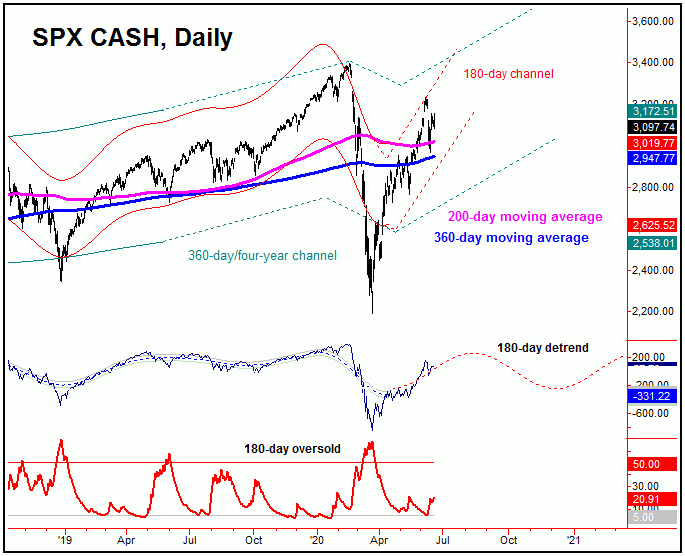
In terms of time, the upward phase of the larger 180-day cycle is projected higher into the August - October timeframe of this year, with the next mid-term peak expected to come from this same cycle. If correct, as noted above, the current correction phase of the smaller 45 and 90-day cycles should end up as an eventual countertrend affair, even though it should have further to run before bottoming.
For the bigger picture, as mentioned, a countertrend decline with the 45 and 90-day cycles should give way to higher highs into the August - October timeframe, before forming a much more significant peak with the bigger 180-day component. In terms of price, we see the potential for the SPX to reach up to the 3500-3600 area before the larger cycle attempts to top. From there, another very large percentage decline is expected to play out into early-to-mid 2021.
The Bottom Line
The overall bottom line with the above is that gold's recent correction is seen as complete with the 72-day cycle, with the metal ideally heading higher in the coming weeks - before the next decent swing top attempts to form. As for U.S. stocks, they are in the exact opposite position, with a correction phase currently in force with the 45 and 90-day time cycles, even though the move down is anticipated to end up as a countertrend affair, to be followed by higher highs, upon completion. More on all as we continue to move forward.
Jim Curry
The Gold Wave Trader
http://goldwavetrader.com/
http://cyclewave.homestead.com/


