Have Cycles Been Killed by Bernanke?


Have cycles have been overpowered by central bank intervention? This is a question that many investors have been asking in view of the stock market's relentless strength since November.
Some of the short- and intermediate-term cycles that have been historically reliable for predicting periods of strength or weakness in equity markets have undoubtedly been muted – or in some cases cancelled out completely – by the Fed’s ultra-loose money policy of the last couple of years. Are we therefore to assume that the longer-term yearly cycles will also be annulled by the Fed?
One of the first things I learned when I began studying financial markets was that “liquidity is everything.” Liquidity is in fact the single most important factor in determining the health of a market and it can trump all other considerations, be it fundamental, technical or cyclical.
Consider that the present bull market has continued despite numerous metrics which suggest the rally should have ended long ago. For instance, corporate earnings growth was lower in the fourth quarter of 2012 than in the previous year. Yet equities ignored this and continue to rally in the first quarter of 2013. Fundamental analysts have tried to rationalize this but probably the best explanation I’ve heard was summarized by David Kotok of Cumberland Advisors. He writes, “We continue to argue that classic and typical methods have to be set aside in an era in which the short-term interest rate is near zero; hence, the equity risk premium determined on the short-term interest rate is near infinity.” Kotok expressed concern over the eventual unwinding of the Fed’s policy, but for now is committed to being fully invested – a sensible response to unlimited central bank support.
Another respected analyst, Bert Dohmen of Dohmen Capital Research, points out the technical flaws that have emerged in the stock market in the last few months. Yet despite these flaws, the market continues to rally. “The massive monetary creation by the Fed is producing the fuel for the rally,” he writes. “Unless you think that will stop, the market should rise until Bernanke leaves, though with periodic market corrections. We all know that this cannot end well. But the day of reckoning may still be a long time in the future. The pessimists have given too much credence to the reality of the unsustainable debt globally and not enough importance to the power of infinite money creation by the central banks.”
Foreign inflows into U.S. equities have also been driven more recently by euro zone and China weakness. This has been an overlooked aspect of equity market strength at home as other nations experience the effects of weak economies and are looking for a perceived “safe haven” from domestic woes. The U.S. aptly fits the description as one of the strongest financial centers at the present time.
To further answer the question of whether central bank policy can overpower cycles, let’s look at some past analogues. Perhaps the biggest instance of a yearly cycle “failure” was in 1954. According to the cycle account of the Kress 60-year cycle, 1954 should have been a big down year for equities. Yet the stock market boomed in ’54, achieving a 25-year high and finally overcoming the 1929 all-time high. The 60-year cycle is admittedly a key long-term cycle; in fact it forms the basis of the Kress 120-year Mega Cycle. 1954 was also the year that the current 120-year cycle (the one that began in the mid 1890s) peaked. Not only was there the counter-balancing peak of the 120-year cycle in 1954, but as Mr. Kress himself also pointed out the Depression years had done much to unwind the excessive debt which contributed to the Great Depression.
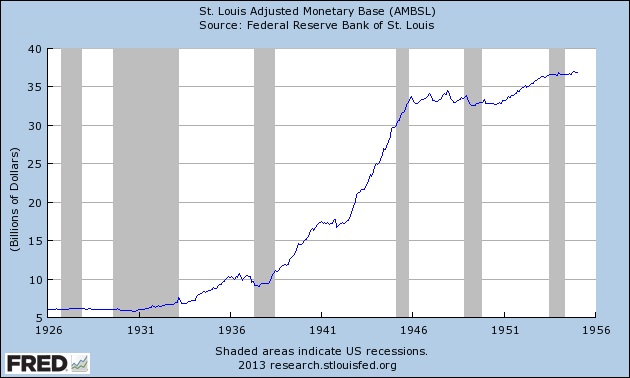
More pertinently, money supply growth had greatly expanded in the 1940s and in leading up to 1954. The Fed was young and inexperienced and barely had the policy tools to cope with the Great Crash of ’29. It was heedless of the fact that by contracting money supply in the year leading up until 1929 it actually helped facilitate the crash and subsequent depression. After the hard Depression years, however, the Fed learned some valuable lessons and realized that “easy money” was the way to go as far as inflating the country to prosperity.
In defense of the Kress cycles I will point out that while the stock market may have ignored the 60-year cycle bottom of 1954, there has never been an instance of the 40-year cycle being ignored by the market. The last 40-year bottom was in 1974 and it produced a major bear market and economic recession, as did the previous one in 1934. The upcoming 120-year cycle bottom scheduled for late 2014 includes the latest 40-year cycle.
It’s still debatable whether the recovery bull market can continue much past 2013. With some analysts believing that Fed Chairman Bernanke’s successor next year won’t continue his ultra-loose money policy, there is certainly a possibility that 2014 will vindicate the long-term cycles. But the stock market game isn’t about next year; rather it’s about the hear-and-now. And for now investors should be focused on the opportunities that Bernanke’s policy has presented them.
Don Hays is fond of saying, “Bull markets don’t end until the Fed takes away the punch bowl.” Another way of expressing this is in the Wall Street maxim, “Don’t fight the Fed.” As long as the Fed is committed to “QE infinity” there’s no reason to expect a premature end to this bull market. I’m sure Mr. Kress himself would agree – let’s take advantage of the opportunity while it lasts.
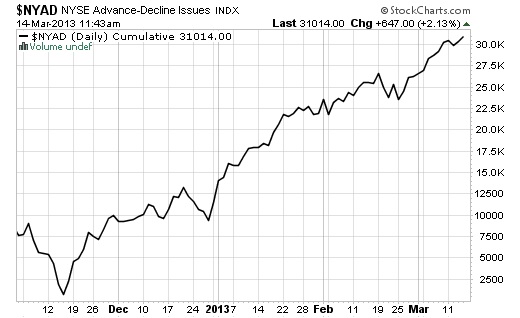
Advance-Decline Line
Recently you’ve heard me make observations about the strength in the NYSE advance-decline (A-D) line. The A-D line is a basic indicator of market breadth which tells you how many stocks are rising or falling on a daily basis. The signals this market provides have often proven to be invaluable in predicting market rallies and declines.
The A-D line is calculated by subtracting the number of today’s declining stocks from the number of today’s advancing stocks, then adding that number on to yesterday’s A-D value. If the major averages are rising but the A-D line is falling, it suggests that market breadth is contracting and that a market decline is likely imminent. If the slope of the A-D line is rising while the market is trending higher, the market is said to be healthy.
The late Ralph Bloch, chief market technician for Raymond James for many years, was a big believer in using the A-D line to confirm bull markets. Back in 2004 he wrote a report on the A-D line:
“I have conducted several studies asking, ‘If something changes, what and why did the change occur?’ I asked my research students to go back to 1929 and look at every time the Dow made a new high and the advance-decline index failed to confirm. There were roughly 15 times. There are very few absolutes on Wall Street. This is as close as it gets. Every one of those 15 times preceded a measurable sell off.
“When the Dow is making new highs, but fewer and fewer stocks are doing so, we have a recipe for disaster. The stock market can only continue to rally for just so long with stocks getting more and more narrow. So if you were aware of this sequence, you would have been out of the market prior to the 1987 top, the 1990 top, the 1998 severe sell off, and the top in 2000. I started to warn in late 1999 because breadth continued to get more and more narrow. And that continued for a long time.
“So there were 15 times going back to 1929 when a decline in breadth preceded a major sell off. You want to be aware of this, because its track record is incredibly important.”
Ideally you want to see the A-D line confirming a market rally by making higher highs on a weekly and monthly basis. A notable exception to this occurred back in 1997 when the A-D line began lagging while the major averages were powering to higher levels. By late October of that year the market experienced a collapse. Although it can sometimes take several months for the lagging breadth to have an effect on the runaway momentum market, failure to confirm in the A-D line never ends well.
Presently the A-D line has been confirming the new highs in the Dow and S&P as shown below. The A-D line has been healthy for the last several weeks and has given us no sign that the market’s interim uptrend is in danger of failing. We’ll be monitoring the advances and declines closely for signs of negative divergence, but for now the A-D line is confirming the bull market.
Gold
Improving economic macro data in the U.S. has given investors every incentive to commit cash to equities instead of to safe haven instruments such as gold and bonds. Most recently, the weekly jobless claims fell by 7,000 to 340,000, reaching a six-month low. Household wealth rose to a five-year high in Q4 2012 due to rising home prices, according to the latest Fed Flow of Funds report. The net worth level of households peaked at $67.4 trillion compared to the current level of $66.06 trillion. As Sharps Pixley recently observed, “The underlying improving tone in the U.S. economy has prompted investors to buy equities and reduce their bets on gold prices. Even Japan reported a much higher-than-expected GDP growth of +0.2 percent in Q4.”
Thus we see the paradox of loose money for the gold investor: it isn’t the availability or lack thereof that ultimately determines gold’s future, but rather the availability (or lack thereof) of volatility and the fear and uncertainty it brings. Until this uncertainty returns to financial markets, any improvement in the gold market is likely to be of short-term duration and of interest to traders and speculators. Investors, meanwhile, are still waiting for that fateful change of tone which will reverse gold’s sideways course since 2011.
Momentum Strategies Report
The stock market recovery is nearly four years old, and investors wonder if it will continue. While many experts have made forecasts for the coming year, few have been as impressive as the Kress cycles in projecting the market’s year-ahead performance since the recovery began.
Each year I publish a forecast for the coming year based on a series of historical rhythms known within Kress cycle theory. Last year’s forecast was remarkably accurate in predicting the pivotal market turns, including the June 1 bottom in the S&P.
Here’s a sampling from last year’s forecast:
“The first five months of 2012 will likely be characterized by greater than average volatility....This will create a level of choppiness to coincide, if not exacerbate, the market’s underlying predisposition to volatility owing to the euro zone debt crisis…the May-June 2006 stock market slide could be repeated in May-June 2012. Our short-term trading discipline should allow us to navigate this volatility and there should be at least two worthwhile trading opportunities between [January] and the scheduled major weekly cycle around the start of June 2012. From there, the stock market should experience what amounts to the final bull market leg of the current 120-year cycle, which is scheduled to bottom in October 2014.
“Keeping in mind that like snowflakes, no two markets are exactly alike, the Kress cycle echo analysis for 2012 tells us to expect a final upswing for stocks in the second half of the year with the first half of 2012 likely to be more favorably to the bears, especially if events in Europe are allowed to get out of hand.”
This is your opportunity to find out what the Kress cycles are telling us to expect for 2013. Subscribe to the Momentum Strategies Report now and receive as my compliments to you the 2013 Forecast issue.
In addition to that you’ll also receive the MSR newsletter emailed to you each Monday, Wednesday and Friday. MSR provides reliable forecasts and analysis of U.S. and global markets based on internal momentum, cyclical and technical factors. Low-risk stock and ETF recommendations are also made based on my proprietary system of selection. Specific entry and exit instructions are also given for each recommendation.
********
[For the complete 2013 Kress cycle forecast for the U.S. stock market and the latest newsletters, subscribe to the Momentum Strategies Report at the link below.]
http://www.clifdroke.com/subscribe_msr.mgi
Clif Droke is the editor of the three times weekly Momentum Strategies Report newsletter, published since 1997, which covers U.S. equity markets and various stock sectors, natural resources, money supply and bank credit trends, the dollar and the U.S. economy. The forecasts are made using a unique proprietary blend of analytical methods involving cycles, internal momentum and moving average systems, as well as investor sentiment. He is also the author of numerous books, including most recently “2014: America’s Date With Destiny.” For more information visit www.clifdroke.com


