A Head & Shoulders Pattern And The Elliott Wave Forecast For Mining Stocks


The HUI Mining stocks have formed a pretty impressive Head & Shoulders top pattern. This may be telling us that as the general stock market declines, Mining stocks (a hybrid of an operating company of underground metals, with the benefit of gold pricing once it is above ground) will also follow stocks lower. The estimated downside from this pattern is around 190ish. It closed at 230.39 Friday, September 24th. Here is the pattern chart:
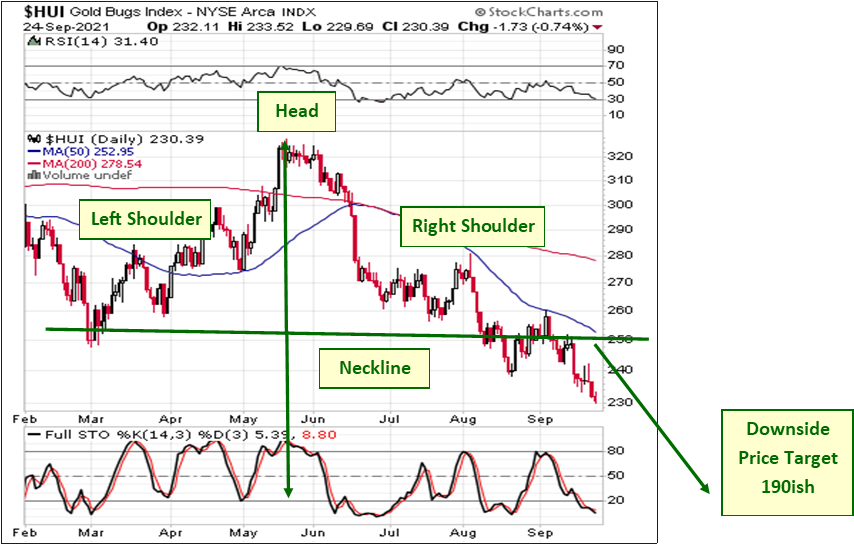
This makes sense, as Miners initially tracked the stock market lower during the crash of March 2020. The general stock market patterns we are tracking are warning another stock market plunge is possible soon. However, with the Fed likely to pump dollars aggressively once the coming stock market plunge has been in play for a while, this Head & Shoulders pattern is telling us that Miners should reach their projected bottom per the above chart and then head sharply higher, along with Gold, diverging with Stocks that are destined to continue lower.
Supporting this expectation is the Elliott Wave mapping forecast for Mining stocks as measured by the HUI. First let’s take a look at the long-term forecast, then we will examine the shorter-term degrees of trend with several charts.
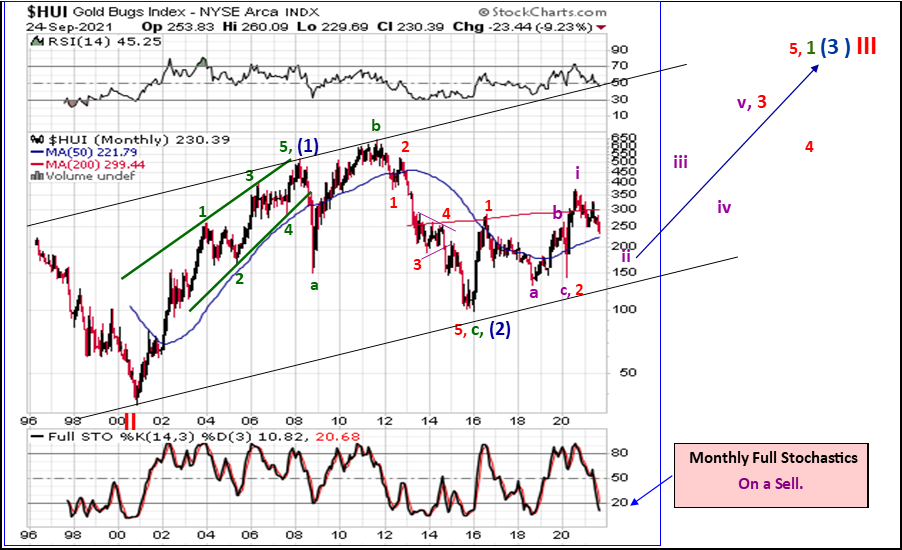
Mining stocks are inside a long-term rising trend, inside Primary degree wave (3) of a larger Cycle degree III. They have a long way to go before reaching a large degree top. Within this Primary degree wave (3), then have completed waves 1-up in 2016, and 2-down in 2020, its bottom arriving at the end of the March 2020 crash. Since then, they have risen in small degree i-up and are presently declining in small degree ii-down. Here is a close-up view of this mapping.
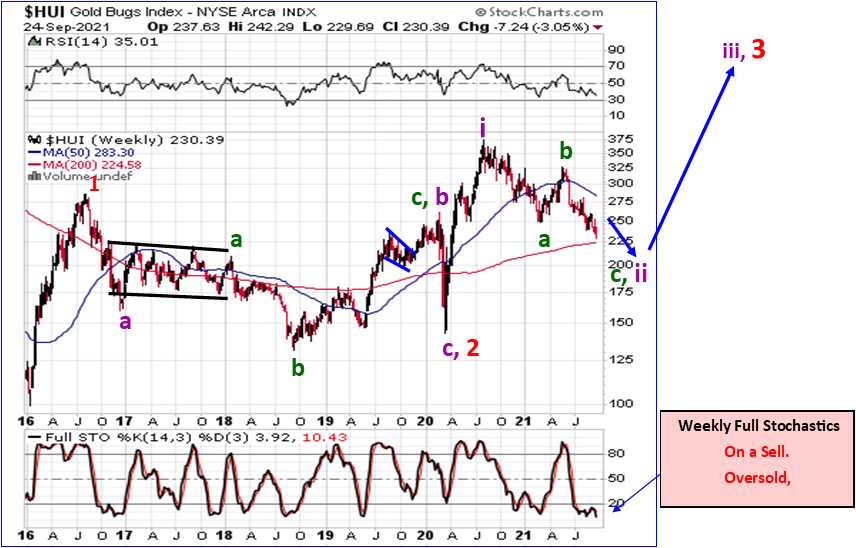
The small degree wave ii down move is progressing toward its finish line, but there is more downside work coming before it reaches a bottom, one that should not be breached for many years to come. The next two charts focus on the final subwave c-down pattern that will complete ii-down.
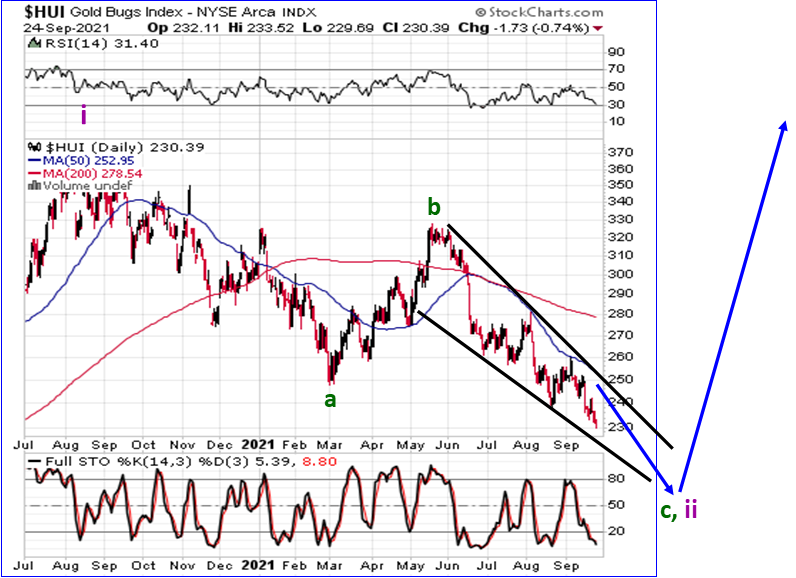
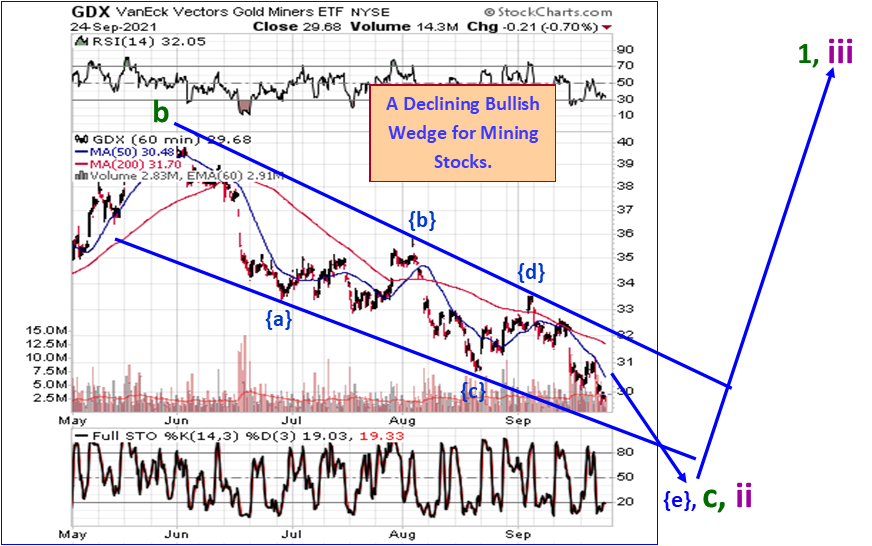
This last chart shown above resets the mapping to the Exchange Trade Fund GDX representation of Mining stocks, which correlates closely to the HUI. This shows a very interesting pattern, a declining Bullish Wedge is occurring as the Micro degree wave c-down to finish ii-down. This pattern is now in its final stages, subwave {e} down, with a downside price target potential of 190ish for the HUI and 27ish for the GDX. This pattern looks like it could bottom in late 2021 if the speed and proportionality of the immediate prior waves, continues.
Gold could track this HUI pattern to some degree, as its Bullish Cup and Handle pattern is also finishing its declining final pattern, the Handle.
At Dr. McHugh’s www.technicalindicatorindex.com we track the short-term waves that make up these larger degree trends, and chart them in our forecast newsletters, and have developed several proprietary Buy/Sell indicators that help us identify when the next significant move is starting for the major stock indices, as well as for Gold, Silver and Mining stocks, and in which direction the move will develop. We also cover the major U.S. stock markets in our reports. We publish these indicators in every Newsletter to subscribers. We offer education on how to trade markets up or down, based upon these indicators, patterns, and the overbought / oversold conditions that they identify.
*********


