History Rhymes: Does USDX’s Uprising Mean Gold’s Climax?


The yellow metal’s behavior looks more bearish now than it did in 2017-2018. The USDX has a lot of bullets in its chamber, and gold can be riddled with them.
Plenty of warning signs on the near-term horizon: The USDX is after a long-tern breakout, traders are reducing net-short positions, and the slightest shift in U.S. dollar sentiment can lead the rest of the herd to follow. If a USDX resurgence is combined with an equity shock, then the precious metals are in for trouble.
Last Friday (Mar. 12), we focused quite a bit on the moves in the gold miners and how their related ETFs (GDX and GDXJ) are faring and which will suffer most during the next phase of the decline. We also touched on this subject last Wednesday as well. It was important to shed light on the miners because they’ve been leading the charge in the corrective upswing. I also wanted to explain the Eurozone’s impact on the precious metals and how crucial it is to examine the bigger picture and how the pieces are all connected. Today, let’s shift our attention over to the currency perspective, namely the USDX.
The price shape and time analogies are truly remarkable right now. It’s quite often the case that history rhymes, but it’s rare for it to rhyme so closely and clearly to what we now see in the case of the USD Index. And the implications for precious metals investors are profound.
On Mar. 8 , I warned that with the USD Index confronting its mid-2020 lows (resistance), a short-term dip could occur in the coming days. But after declining by 0.34% last week, the negativity could be short lived.
Case in point: the 2017-2018 analogue is already in full swing, and while short-term dips were part of the historical journey, the USDX could be about to exit its consolidation phase.
Please see below:
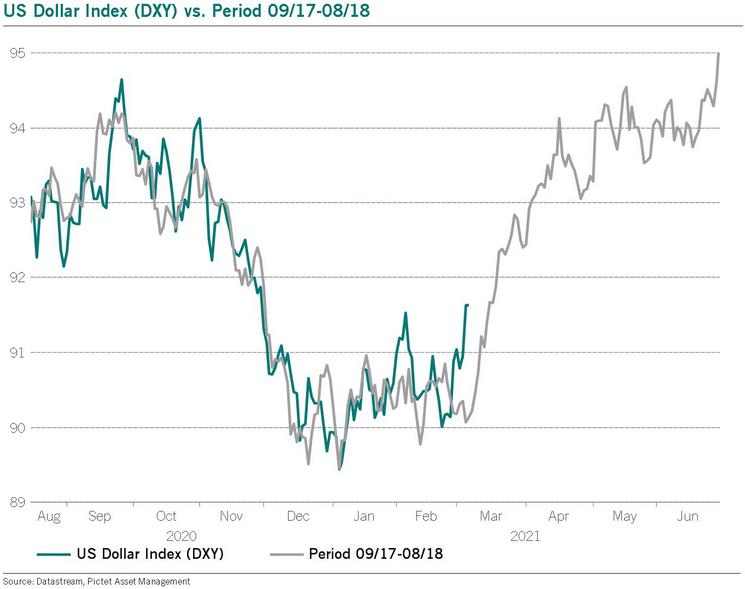
You can also see the similarity between two periods and the technical patterns that they included in the chart below:
Even while looking at the price moves for just a second, the size and shape of the 2017-2018 analogue clearly mirrors the 2020-current price action. Although this time, it took less than 118 days for the USD Index to move from peak to trough.
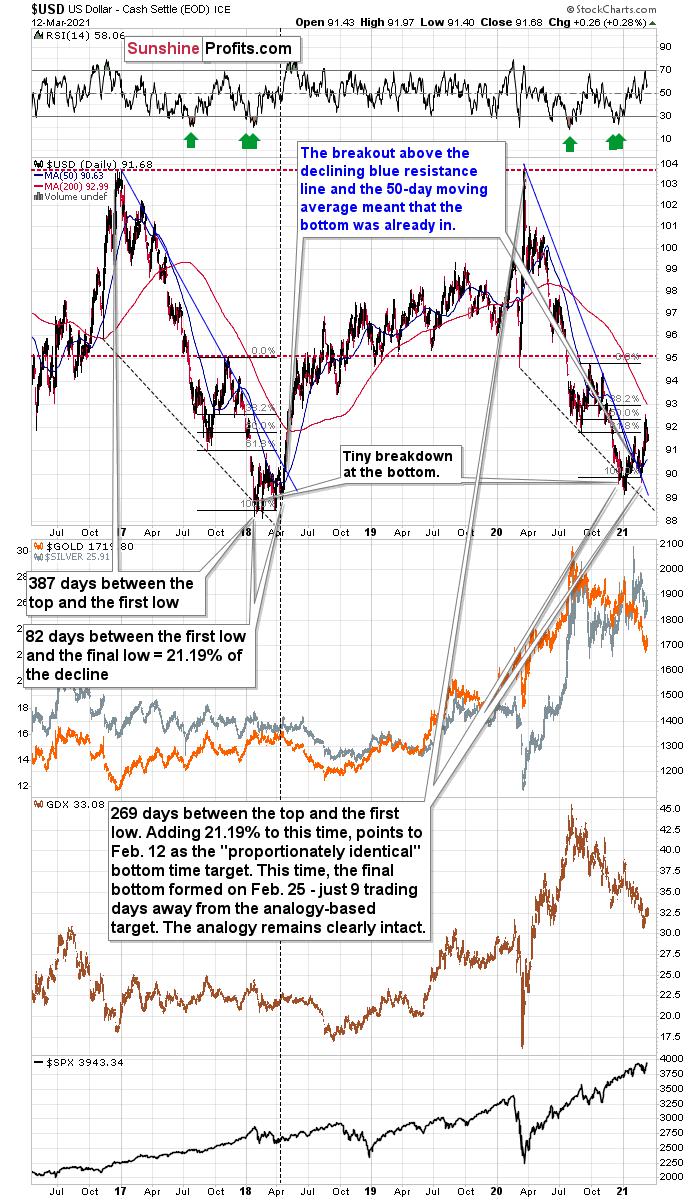
In 2017-2018, it also took 82 days for the USDX to form a final bottom (the number of days between the initial bottom and the final bottom) and the duration amounts to 21.19% of the overall timeframe. If we applied a similar timeframe to today’s move, then the USD Index should have bottomed on Feb. 12. It actually bottomed (finally) on Feb. 25, which was just 8 trading days away from the former date. Taking into account the sizes of the moves that preceded the previous declines (they took approximately one year to complete), this is extremely close and an excellent confirmation that the self-similar pattern remains intact.
In addition, as the USDX approached its final bottom in 2017-2018, gold traded sideways. Today, however, gold has been in a downward spiral. From a medium-term perspective, the yellow metal’s behavior is actually more bearish than it was in 2017-2018.
Finally, the USD Index’s breakout above its 50-day moving average (which it still holds today) is exactly what added gasoline to the USDX’s 2018 fire. Case in point: after the 2018 breakout, the USDX surged back to its previous high. Today, that level is roughly 94.5.
Moreover, gold’s trepidation alongside the USD Index strength on Mar. 12 adds even more validity to the 2017-2018 analogy.
I wrote on Mar. 10:
It’s not true that there were no pullbacks during the 2018 rally. There were, but they were simply too small to be visible from the long-term point of view.
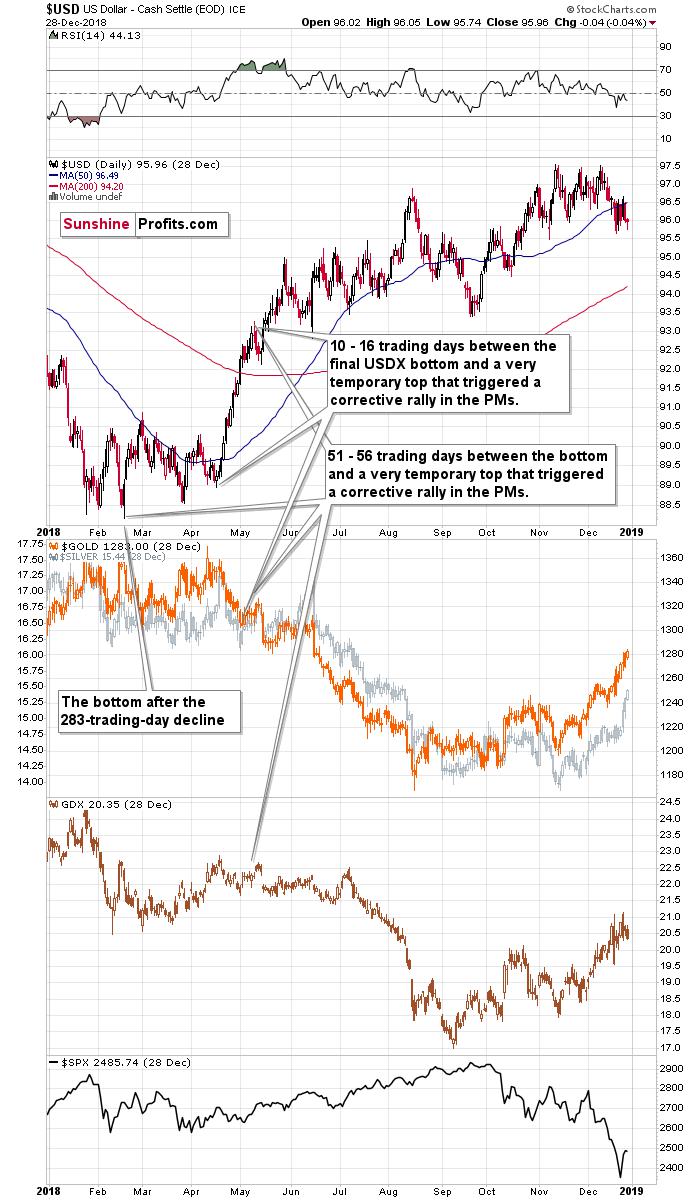
The first notable pullback took place in early May 2018, and it contributed to a corrective upswing in the precious metals market. To be precise, the USD Index declined after rallying for 56 trading days, but gold rallied earlier – 51 trading days after the USD Index’s final bottom. The USDX’s immediate-top formed 16 trading days after its final bottom, and gold’s bottom formed 10 trading days after the USD’s final bottom.
Comparing this to the size of the previous decline in terms of the trading days, it was:
-
51 – 56 trading days / 283 trading days = 18.02% - 19.79%
-
10 – 16 trading days / 283 trading days = 3.53% - 5.65%
More importantly though, when the USD Index turned a short-term decline into consolidation in mid-2018, gold’s hesitant reaction highlighted the yellow metal’s anxiety. And what followed? Well, gold’s next move was significantly lower, while the USD Index’s next move was significantly higher. This means that it was likely a good idea that we took profits from our long positions recently when the GDX moved to $32.96 (opening at $30.80 - $31).
Please see below:
In addition, if we analyze the pairs’ very recent price action, it’s a splitting image.
On Friday (Mar. 12), the USD Index rallied by 0.28%, while gold was (roughly) directionless despite the intraday volatility. And just like in 2017-2018, the yellow metal’s behavior signals a forthcoming climax. As a result, gold and the USD Index are behaving exactly as they did before going their separate ways in 2017-2018. And this means a bearish gold price prediction for the following weeks (not necessarily hours, though).
Please see below:
To explain, I wrote on Mar. 10:
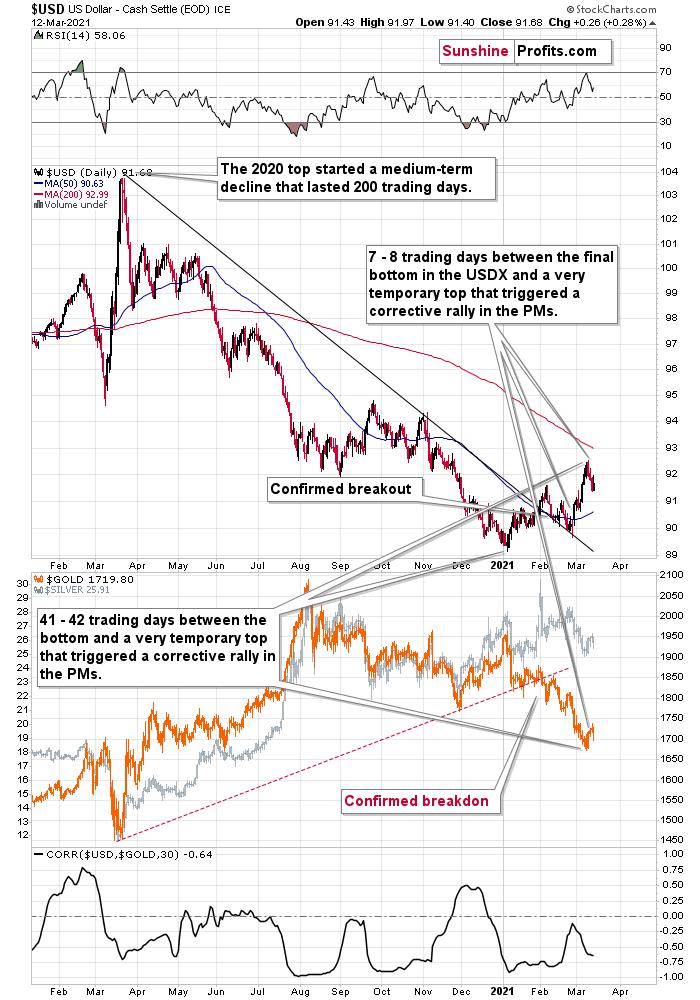
Let’s examine the current situation: the preceding decline lasted for 200 trading days and there were 41 – 42 trading days between the final USDX bottom and the short-term reversals in gold and USDX. Comparing this to the final USDX bottom, we get 7 – 8 trading days.
Applying the previous percentages to the length of the most recent medium-term decline in the USD Index provides us with the following:
-
18.02% - 19.79% x 200 trading days = ~36 - ~40 trading days
-
3.53% - 5.65% x 200 trading days = ~7 - ~11 trading days
The above estimation of about 36 – 40 trading days almost perfectly fits the current 41 – 42-day delay, and the estimation of about 7 – 11 trading days almost perfectly fits the current delay of 7 – 8 trading days.
In other words, the analogy to the 2018 performance does not only remain intact – it actually perfectly confirms the validity of the current corrective upswing. Once again, it’s very likely just a pullback, not a big trend reversal.
The bottom line?
Given the size of the 2018 upswing, 94.5 on the USD Index is likely the first, of many, potential upside targets.
Adding to the list of upside catalysts, the USD Index still has plenty of other bullets in its chamber. For instance, we’re also in the early innings of a shift in U.S. dollar sentiment. With short interest hitting an all-time high in late-2020, it was a complete fire sale. Today, however, short interest may have peaked.
Please see the below chart based on the CoT report :
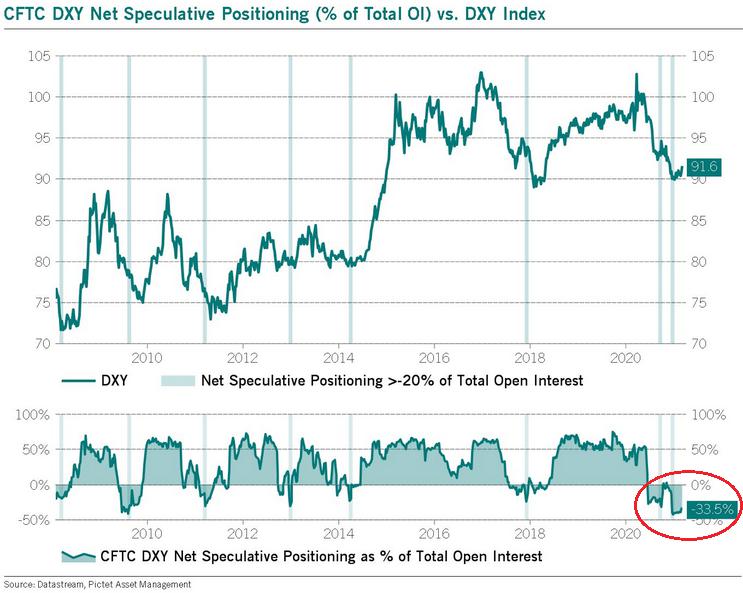
Please consider how big rallies followed the moments when the net speculative position as % of total open interest started to rally back up after being oversold for months. The situation here is still more extreme than it was in early 2018 and 2014, suggesting that the upcoming rally might be bigger than the ones that we saw then.
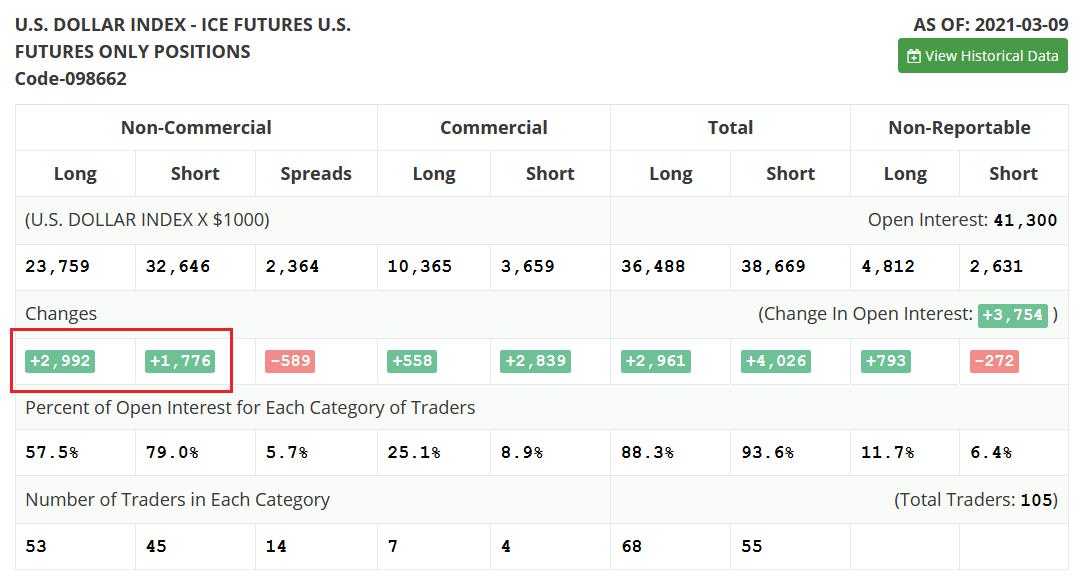
As further evidence, speculative futures traders ( non-commercial ) actually reduced their net-short positions by 1,216 contracts last week (the net of the two values in the red box below). As a result, the slightest shift in sentiment could lead the rest of the herd to follow.
Finally, let’s not forget that the USD Index is after a long-term, more-than-confirmed breakout. This means that the long-term trend for the U.S. dollar is up.
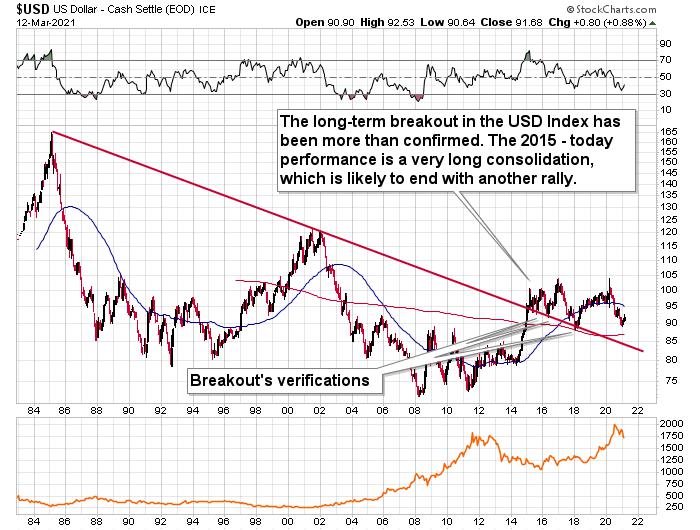
In conclusion, the USD Index is likely shifting from consolidation to ascension. With the size, scope and duration of the recent price action mirroring 2017-2018, it’s only a matter of time before the USD Index’s medium-term breakout gives way to a material breakthrough. What’s more, the USD Index is finally reacting to the rise in U.S. Treasury yields . Initially ignoring the late-2020 surge, a bottom, and subsequent rally in the U.S. 10-Year Treasury yield has lifted the USD Index 80% of the time since 2003. And with the relationship seemingly restored in 2021, the combination is profoundly bearish for the PMs, especially given today’s triangle-vertex-based reversal in gold.
Thank you for reading our free analysis today. Please note that the above is just a small fraction of today’s all-encompassing Gold & Silver Trading Alert. The latter includes multiple premium details such as the targets for gold and mining stocks that could be reached in the next few weeks. If you’d like to read those premium details, we have good news for you. As soon as you sign up for our free gold newsletter, you’ll get a free 7-day no-obligation trial access to our premium Gold & Silver Trading Alerts. It’s really free – sign up today.
Przemyslaw Radomski, CFA
Founder, Editor-in-chief
Sunshine Profits: Effective Investment through Diligence & Care
* * * * *
All essays, research and information found above represent analyses and opinions of Przemyslaw Radomski, CFA and Sunshine Profits' associates only. As such, it may prove wrong and be subject to change without notice. Opinions and analyses are based on data available to authors of respective essays at the time of writing. Although the information provided above is based on careful research and sources that are deemed to be accurate, Przemyslaw Radomski, CFA and his associates do not guarantee the accuracy or thoroughness of the data or information reported. The opinions published above are neither an offer nor a recommendation to purchase or sell any securities. Mr. Radomski is not a Registered Securities Advisor. By reading Przemyslaw Radomski's, CFA reports you fully agree that he will not be held responsible or liable for any decisions you make regarding any information provided in these reports. Investing, trading and speculation in any financial markets may involve high risk of loss. Przemyslaw Radomski, CFA, Sunshine Profits' employees and affiliates as well as members of their families may have a short or long position in any securities, including those mentioned in any of the reports or essays, and may make additional purchases and/or sales of those securities without notice.
********
 Przemyslaw Radomski, CFA, is the founder, owner and the main editor of SunshineProfits.com. You can reach Przemyslaw at: http://www.sunshineprofits.com/help/contact-us/.


