How the Markets Performed This Week


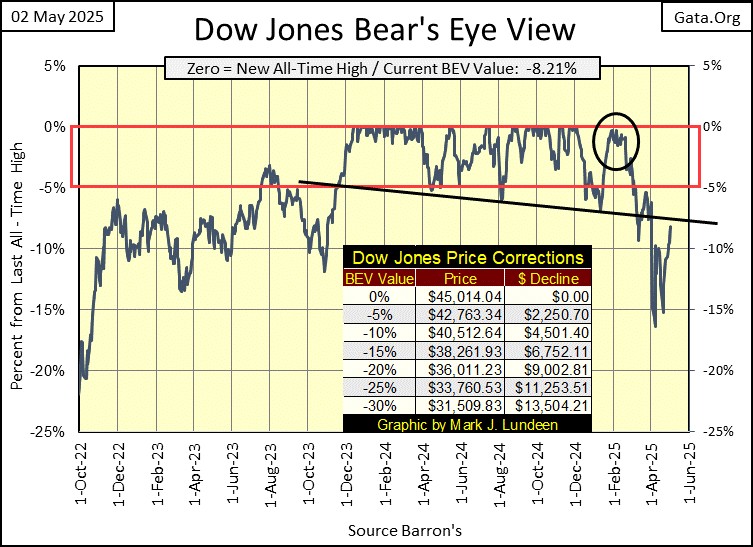
At the close of the first week of May, 2025, looking at the Dow Jones Bear’s Eye View (BEV) chart below, it could be interpreted in one of two ways;
- the Dow Jones is rebounding from a correction within the context of a bull market advance,
- the Dow Jones is advancing in its first correction, within a bear market.
In example #1, the case for the continuance of the bull market, we’ll soon see the Dow Jones once again break into scoring position, and from there the Dow Jones will see new BEV Zeros, new all-time highs.
In example #2, we are in the early stages of a bear market. We may also see the Dow Jones advance to new all-time highs from here, but most likely not. If this is a bear market, and I’m assuming it is, no matter what bullish market action we see from here, the big money made during the previous advance, is now best seen in the market’s rearview mirror. In other words; pennies to the upside (at best), and many dollars to the downside.
With markets, we are dealing with market risk; the risk investors have to their invested funds, and yes, time. One should only accept those risks IF one can reasonably expect to be paid an appropriate return, for accepting those risks. In May 2025, I don’t think investors are receiving an appropriate return for accepting the risks this market (stocks and bonds), has to invested funds.
Just how much risk does this market offer invested funds? I can’t display the risks I see as a statistician could. But the chart below shows the risks I see this market has, a chart that frankly should frighten you too.
Here are the highlights of the chart;
- The Red Star marks August 1971, when the US Government removed the dollar from the Bretton Woods’ $35, gold peg.
- The Green Triangle marks August 1982, where with the Dow Jones trading under 800, the current (is it still going?) bull market began.
- Box #1 is the top of the NASDAQ High-Tech bull market.
- Box #2 is the top of the sub-prime mortgage bull market.
- Box #3 shows the 04 December 2024 top in the Dow Jones.
It didn’t take long after the dollar was freed from its $35 gold peg (Red Star), before the idiots at the FOMC began inflating their epic financial bubble in the stock market (Green Triangle) seen below.
Focusing on the Boxes above, Box #1 saw the Dow Jones trade over 11,700 in January 2000, an inconceivable, enormously large valuation at the time. Of course, being a market top, it was followed by a two-and-a-half-year bear market that took the Dow Jones down by 38%.
Box #2 saw the Dow Jones trade over 14,100 in October 2007. The bulls at the time couldn’t believe how lucky they were, as the second deepest percentage decline in Dow Jones history began, taking the Dow Jones down by 54% in March 2009, Red Oval. The only other bear market bottom that saw a larger percentage decline occurred during the Great Depression bear market, an 89% market decline.
Stop and think about this for a moment; within the Red Oval, is the second largest bear market decline in Dow Jones history. Yet below, it appears as a correction within the context of the larger bull market advance, that topped last December.
There is something so wrong with that!
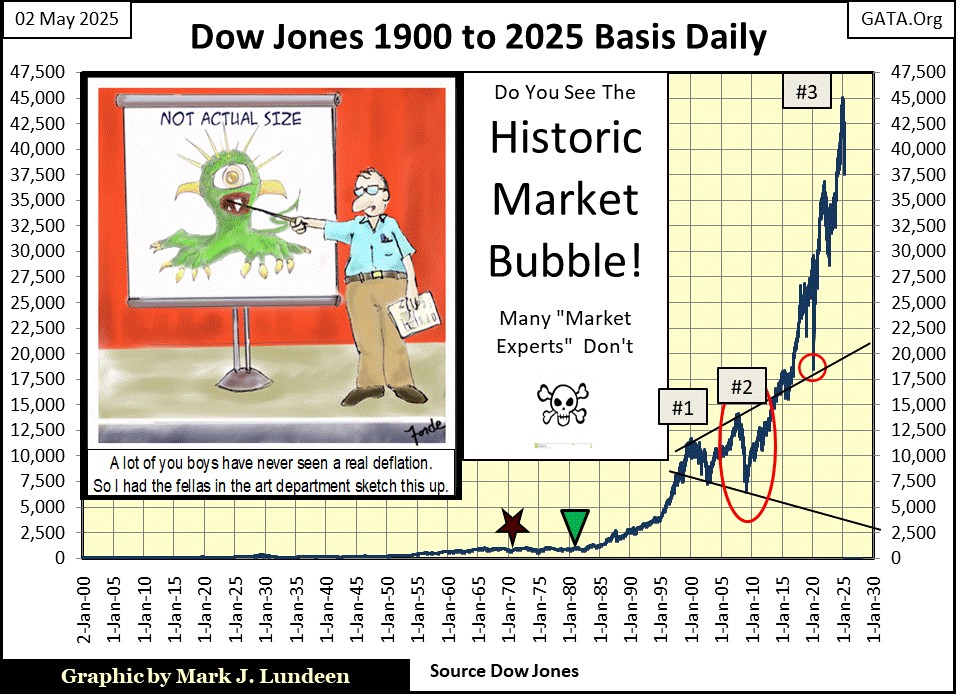
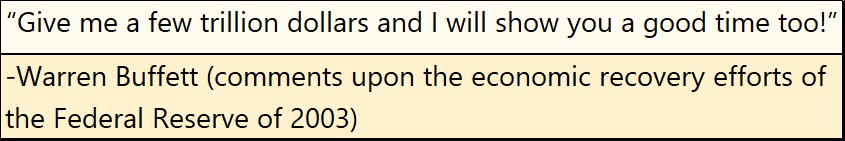
Box #3, is the market advance seen from the 09 March 2009, 54% bear-market bottom. This astounding advance, from March 2009 to just last December, was funded by four QEs; many trillions of dollars of monetary inflation “injected” directly into it by the idiots at the FOMC, exactly as Warren Buffett said below in 2003:
No doubt about it, good times were had by all. But this amazing advance was only a bubble inflated into the stock market, and all bubbles ultimately go bust, while epic bubbles, such as seen above, bust epically. So no, I can’t recommend anyone investing in this stock market, but I am willing to say; watch out below.
This week, I decided to insert the table I use in my Dow Jones BEV charts, in this chart of the Dow Jones in daily bars below, as it is useful in both types of charts.
Daily volatility was reduced this week, seen in the smaller daily bars below, as the Dow Jones made its way above its BEV -10% line. If daily volatility continues to be contained, we can expect the Dow Jones to cross its BEV -5% in the weeks to come, and then who knows what will follow?
Dow Jones 55,000 by Christmas? As every bull with a calculator knows, that is only a 22% advance from December’s last all-time high of 45,014.
Is that possible? Are there idiots at the FOMC? So sure, it could happen. However, come what may, I’m still a bear.
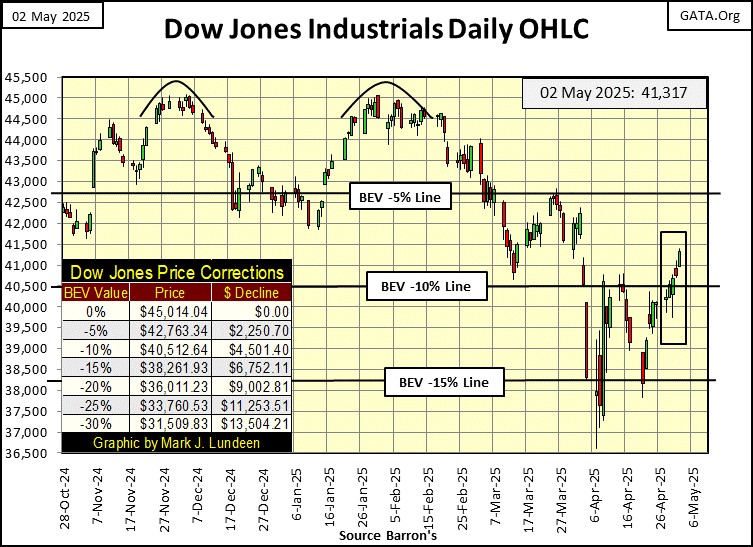
Moving on to my table of major market indexes BEV values below, this week closed with three of these indexes in scoring position, closed between their BEV -5% and 0.00% lines. A month ago, all these indexes BEV values were below their BEV -10% lines, except for one; the Dow Jones Utilities Average, with a BEV value of -9.72%. Be it bull or bear, the market’s valuations are once again being inflated.
The long knives are out for the gold and silver miners. The powers-that-be, must not like seeing the XAU above the NASDAQ Banking Index, and are attempting to correct this.
I can understand why this would be. For professional money managers, people who manage other people’s money for a living, selling what they currently have, to then buy a major gold and silver miner, is the best, and easiest way to side-step the humongous risks this market has to invested funds.
But, the gold and silver miners as a group, are like a barnacle on the side of a whale; tiny when compared to the entire stock market, tiny even when compared to companies like Microsoft, or Apple. Should (when) the stock market begins to deflate in earnest, managed money will then look around for a safe place to park their money. Historically, that has been in gold mining.
It wouldn’t take much money flowing into the gold and silver miners, to make the XAU begin to soar like an eagle over everything else trading in the stock market, and that is a situation the Idiot Primate of the FOMC, Powell cannot allow. So, the idiots continue to place downward pressure on the gold and silver miners, so no one managing a few billion dollars gets any funny ideas.
No matter. Of all the indexes seen below, the only one I would risk my money in, is the XAU, because when its day comes, no one, or nothing, will stop its advance into market history.
But there is no direct way to invest in the XAU, as it is used for put and call options, traded at the Philadelphia Exchange. I could be wrong. But the internet has no shortage of sources for recommendations for investments in gold and silver mining.
As I’m not an investment advisor in any sense of the term, I tend not to give specific investment advice; what stocks my readers should, or should not buy. So, why do I write this weekly article about the markets? I’m merely a market enthusiast, doing his personal research on the market, which for my own reasons, I share with others who may find my thoughts on the market useful.
Eskay Mining is my only exception to that rule, and that is as a speculation, offering the prospects of oversized returns. So, Eskay Mining is not for widows or orphans, but my readers may benefit by taking a small position in.
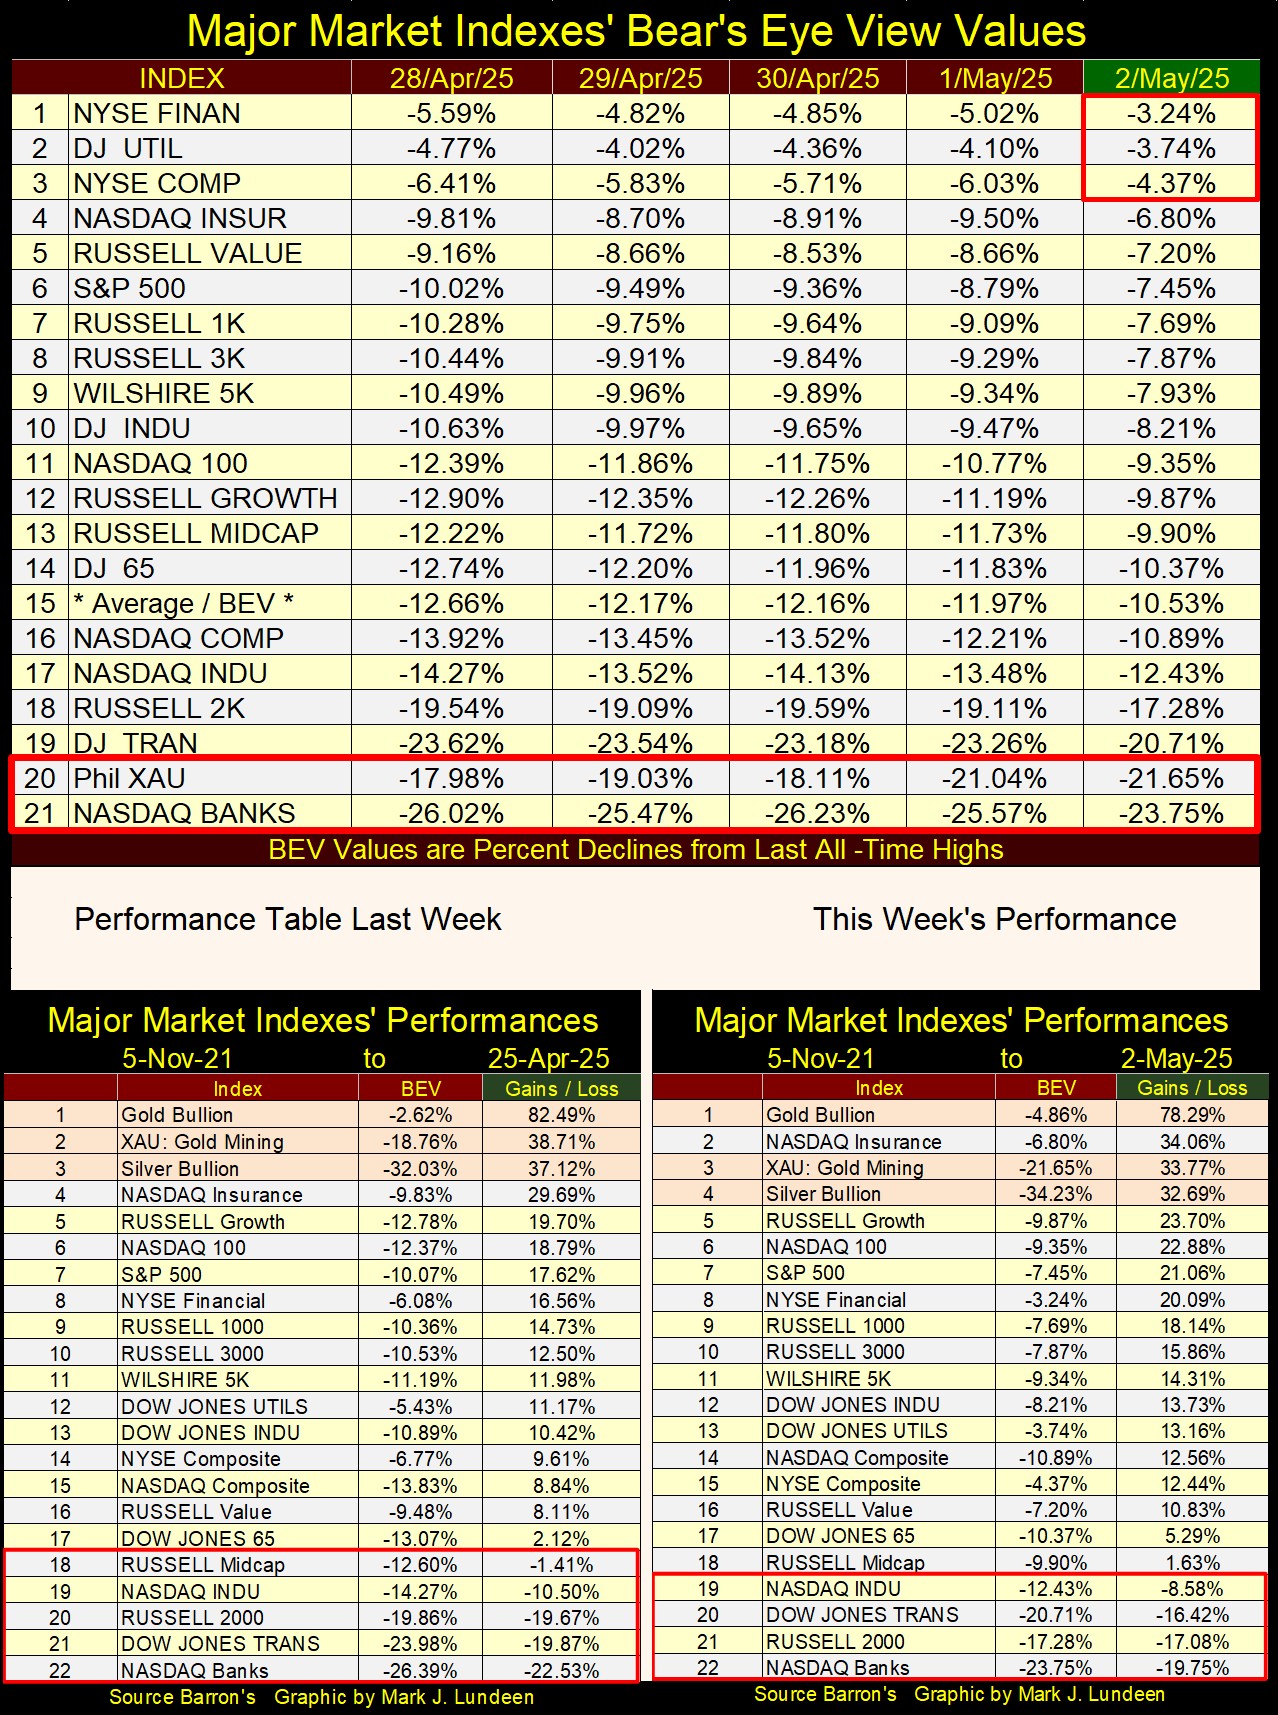
What is with the NASDAQ Insurance Index? It’s at #2 in the performance table for this week. These companies must have agents with names like Knuckles and Lefty, selling policies to people they can’t refuse.
After an over a decade of “going green” with their electrical power grids, by shutting down their coal-fired and nuclear generators, to be replaced with solar and wind powered sources of electricity, this week Spain, and Portugal, stumbled into their new-green future.
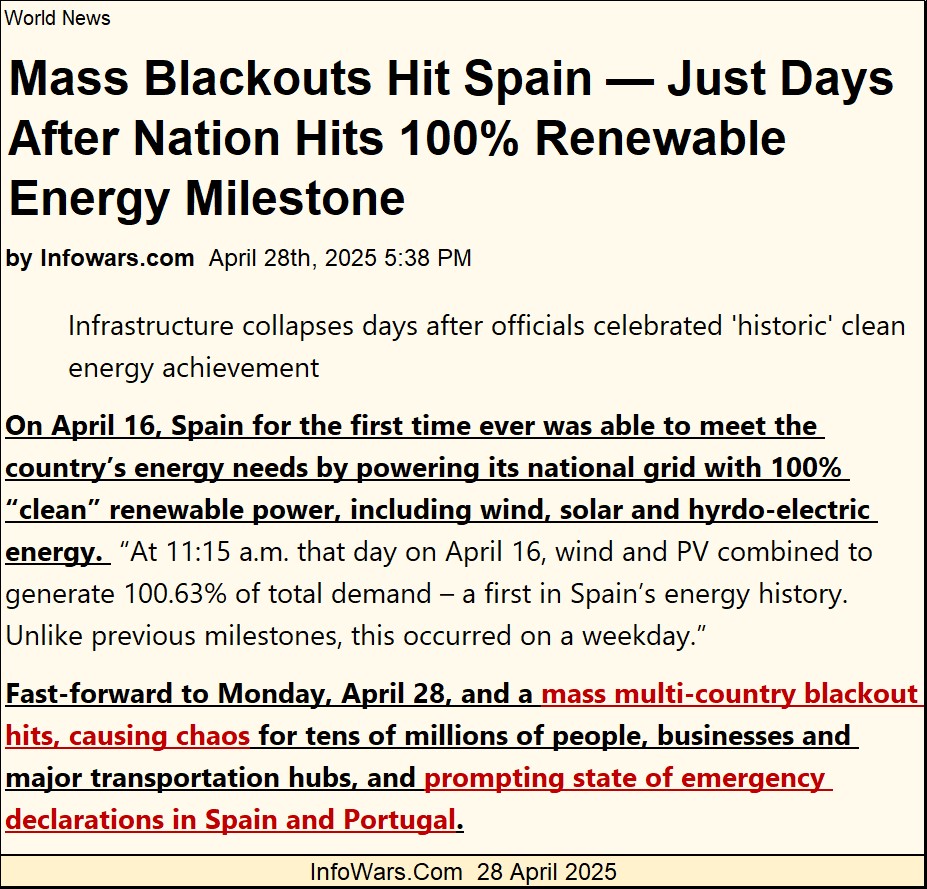
What happened? “The Left;” socialist scoundrels, have dominated European politics for decades. They have proven to be a source of one bad idea after another, as they have since the French Revolution.
Global Warming is one such bad idea, a Leftist-scientific chimera that has funneled tens, if not hundreds-of-billions of dollars and euros into funding leftist’s academic full-employment schemes in European and North American universities. The result of which can now be seen in Spain and Portugal going dark this week.
All of Europe is currently engaged in “going green.” It’s only a matter of time before other European countries go dark, for “going green.” If President Trump hadn’t busted up this green conspiracy Europe has fallen for, the same would soon be happening to us. What happens when Finland or Norway, where in the winter the nights are 20 to 24 hours long, go 100% solar and wind power for their grids? I already know. But it seems they will have to discover that all on their own.
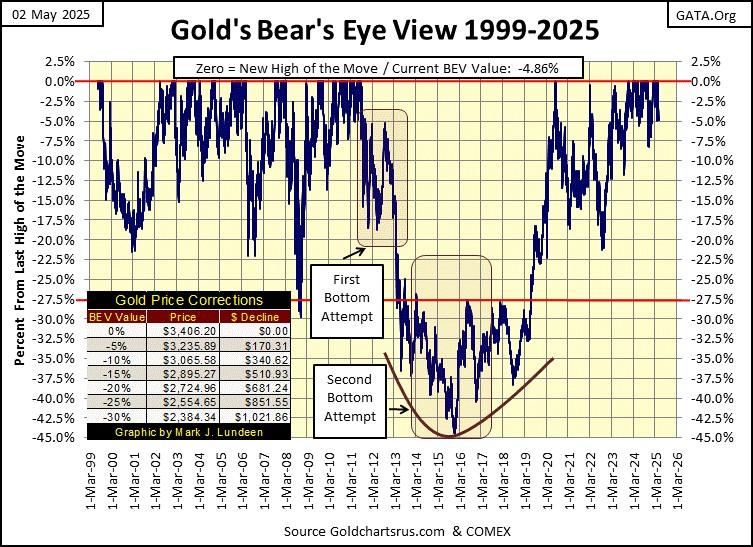
On to gold’s BEV chart below. For the past eighteen months, gold in the main, has closed the week in scoring position, the position in a BEV chart where a market can be expected to generate new all-time highs. Which for gold, was only ten COMEX trading sessions ago, on April 21st.
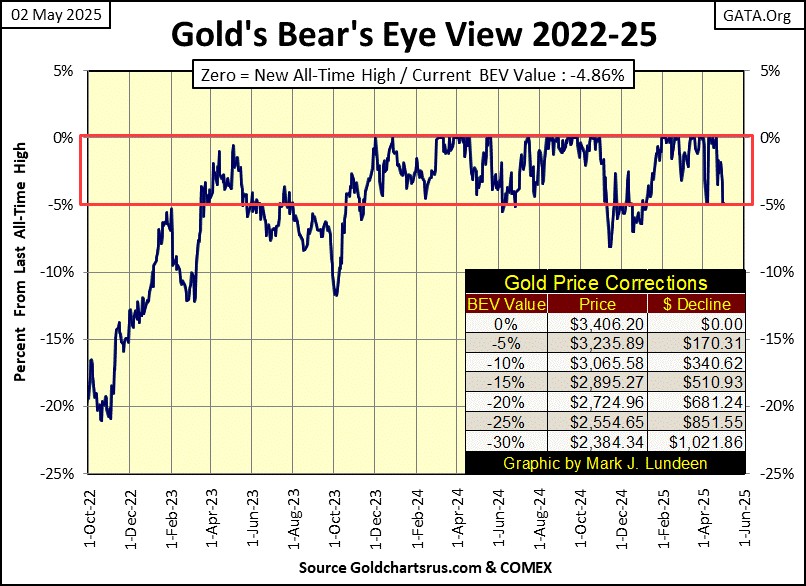
Let’s look at a long-term BEV chart for gold. The current cluster of BEV Zeros, is the first cluster of new all-time highs since 2011, and in-between these two clusters of BEV Zeros, is a big 45% bear-market bottom.
I like that, as that suggests the gold and silver market is far from being overran with wide-eyed bullish newbies. With what was once called: “weak hands” in the market. Something the gold market had in abundance in 2011, just before the big 45% market decline. So, looking at the BEV chart below, I think it’s fair saying the gold market is currently in strong hands, which most likely is why gold has remained in scoring position, somewhere above its BEV -5% line since November 2023.
Gold in its step sum table below is looking good. In March and April, gold saw eleven new all-time highs, or BEV Zeros highlighted in blue and gold in the table below. Following a series of advances like that, it’s normal seeing a market take a well-earned rest, as gold is doing now.
Since gold’s last all-time high on April 21st, nine trading sessions have passed, with six daily declines and only three daily advances for gold. Still, the bears have so far failed to push gold out of scoring position, below its BEV -5% line.
Maybe next week the bears will push gold below its BEV -5% line, and then maybe not. Gold is currently in a period where daily declines are overwhelming daily advances, with little damage done to gold’s valuation, so far. I’m waiting for the coming time where its daily advances once again overwhelm its daily declines, as seen on the Dow Jones side of the table. This should happen in the next week or two, and I’m expecting to see gold making new all-time highs as it does.
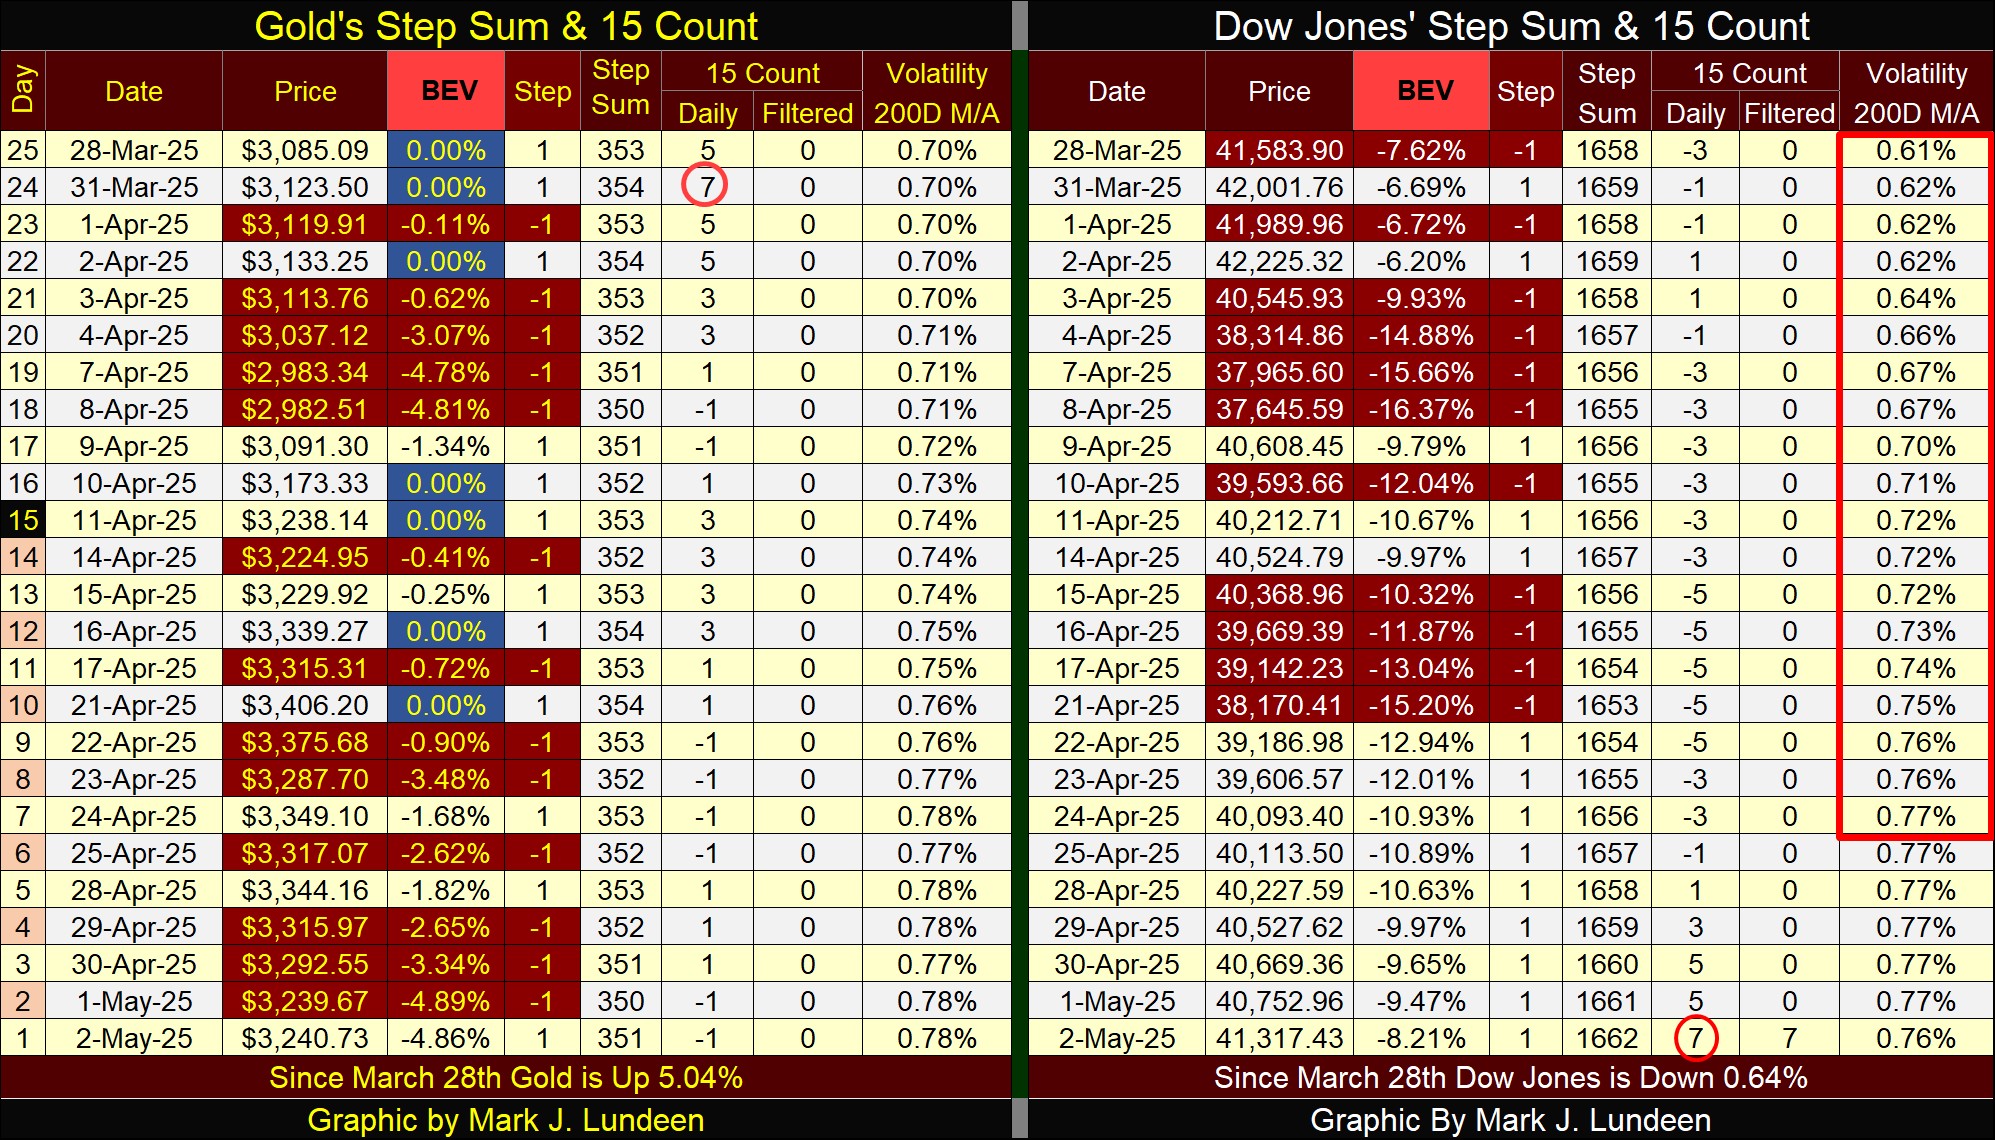
Back to the Dow Jones side of the table; yes, daily advances have overwhelmed daily declines, with the past nine trading days seeing the Dow Jones close up. But now, the Dow Jones’ 15-count is an overbought +7, and markets don’t like being overbought, as seen when gold also saw a +7 in its 15-count on March 31st.
What did gold do then? It began seeing more down days, than daily advances in April, taking its 15-count down. BUT, as the daily declines began to pile up in the table above, so did the new all-time highs. Why did that happen? Maybe because gold is in a bull market, so its valuation is having an easier time going up than down.
Now that the Dow Jones is an overbought market, we’ll have to watch what the Dow Jones does in the weeks to come. Specifically; if a few down days cancels the gains from nine consecutive daily advances seen above. If so, that means the Dow Jones is finding it easier going down than up. Need I say, that isn’t good for the bulls?
However, at this week’s close, we don’t yet know what is to come in the weeks ahead. But I like to anticipate possible scenarios in the market, and I believe that to be the most likely. Like me, my readers will have to wait to see if I’m right or wrong. I’ll be back next week to tell you all about it.
Mark J. Lundeen
*******
More from Gold-Eagle


