How to Swing Trade & Day Trade Spot Gold and GLD Trends
 share
share
 share
share
 share
share
 share
share
 share
share
Over the past couple of months, gold and silver have been uneventful. In this report I have posted weekly charts to show the larger trend of gold and silver. Also I have provided small charts of the US and Canadian gold stock funds GDX and XGD.Because this report has weekly charts, which are a slow and dull time frame to follow, I have added another one of my Kitco Spot Gold Overlay trades, which is a short day trade to liven things up.
GLD ETF - Gold Bullion Price Action - Weekly Chart
I spoke with a few members last week, who wanted me to change my analysis for gold, which I agree with. So I would like to address this now to keep everyone on the same path.
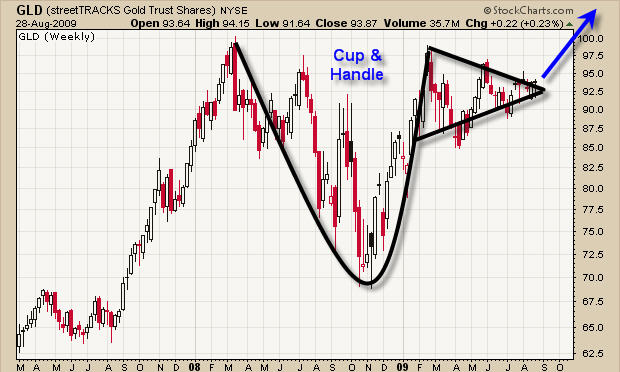
In previous reports I have pointed out the reverse head & shoulders pattern in this weekly chart below. But to be honest, it is not a reverse head & shoulders, which everyone is saying it to be.
Why is gold not in a reverse H & S pattern? Because a reverse H & S pattern is just that, it means the price will reverse from the previous trend. A reverse H & S happens after a downtrend, which forms a bottom and the trend is not moving higher.
Gold has been moving higher, which you can see in 2007 and this large pattern is more like a Cup & Handle pattern - extremely bullish.
SLV ETF - Silver Bullion Price Action - Weekly Chart
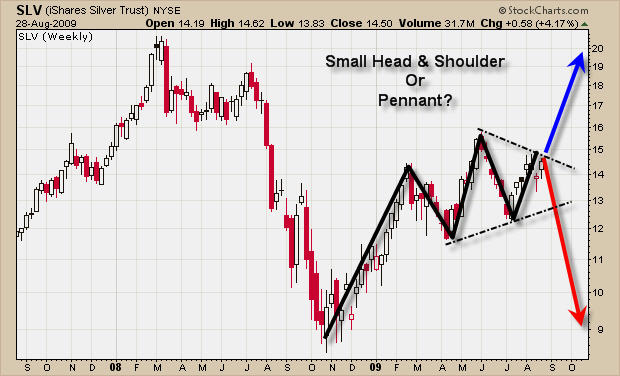
Silver is trading a little different than gold. As you can see the price is trading much lower than the 2008 high. There are also two small patterns forming, which are a small head and shoulders top or a bullish pennant.
Last Friday we saw gold and silver prices jump, but until we get a low risk entry point, I continue to watch these commodities move inside their large weekly price patterns.
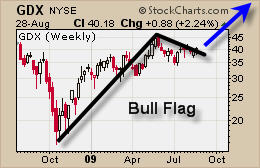
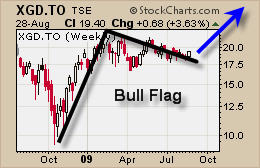
US & Canadian Gold Stock Funds
These small charts show how bullish the price action is this year for gold stocks. But the exciting part, which is tough to see here, is that the Canadian fund is starting to show bullish price action. When both the US and Canadian gold funds are moving together, it means there will most likely be some tradable moves in the near future. Let's keep focused and ready to take action in the coming weeks, as these bull flags near the end of their cycle.
Day Trading Spot Gold - Day Trading GLD ETF
I will keep this short because I have written about this once before and below is the link to read my gold trading strategy in detail.
Day trading spot gold using the real-time kitco overlay chart is what I use to identify a possible day trade. The shaded box below shows a simple waterfall sell off and when I see that price action, I will generally take a position the next day around that time for a short trade in GLD.
I did not think to save this kitco chart until the following day so the waterfall price action was miniaturized because of Fridays rally. Also I would like to note this waterfall pattern happened 3 times in a row last week and I took advantage of them.
My Basic Strategy
Gold tends to move similar to what it did the previous day and traders know this, which is why the patterns starts 5-30 minutes earlier the following day, as we anticipate the move. Moves tend to repeat for up to 3 days. So you identify a sizable move and take action on it the following two days, as long as the rest of the day trades similar to the previous days. I like to scale into positions and once I see it going my way I add one final position to increase my exposure.
I am sure some of you are wondering how I traded GLD at 8am ET? I trade with an online broker that allows me to trade pre-market and post market hours. Not very often these setups happen before 9:30am ET but last week it did.
Important note:
Once you see the price of gold making opposite moves of the previous day, minimize your position or don't take the trade. As you can see in this chart below, the red line is starting to move the opposite way of the previous day (baby blue line) and later in the afternoon it was completely the opposite. This is a warning that there is a shift in the buyers/sellers and you can see the next day prices spiked higher in the opposite direction.
Read my previous Gold Day Trading Guide:

Technical Gold Trading Conclusion
Overall precious metals are trending sideways in their bullish patterns and we are waiting for some low risk entry points.
During slow trading times, which we are currently in, I like to look for other profitable positions to satisfy my need to trade. As a full time trader, it is important to have a few styles of trading, which allow you to profit in any market condition. My main focus is on the commodity ETF's, with low risk setups, but I also day trade GLD when opportunities arise and I also trade extremely over bought/oversold index plays using the leveraged ETF's and focusing on my Active Trading Partners stocks trades, which provides profitable trades week after week. Combining these trading styles allow me to pull money from the market week after week without forcing any positions. I just let perfect setups unfold and I take advantage of them.
Soon I will be providing these gold day trades and index trades for members, which I think is very exciting. If you would like to receive my free weekly trading reports please visit my website at: www.GoldAndOilGuy.comChris Vermeulen
share
share
share
share
share

Chris Vermeulen has been involved in the markets since 1997 and is the founder of Technical Traders Ltd. He is an internationally recognized technical analyst, trader, and is the author of the book: 7 Steps to Win With Logic
Through years of research, trading and helping individual traders around the world. He learned that many traders have great trading ideas, but they lack one thing, they struggle to execute trades in a systematic way for consistent results. Chris helps educate traders with a three-hour video course that can change your trading results for the better.
His mission is to help his clients boost their trading performance while reducing market exposure and portfolio volatility.
He is a regular speaker on HoweStreet.com, and the FinancialSurvivorNetwork radio shows. Chris was also featured on the cover of AmalgaTrader Magazine, and contributes articles to several financial hubs like MoneyShow.com.


