How To Trade Gold Stocks With Momentum


As a technical trader, I like it when multiple charts, indicators, and asset classes agree with each other for trade setups. This short article is to show you some of the things I look at which provide a buy signal for gold stocks.
One of the key trading tips I learned years ago, is that average a sharp price reversal and surge in price, we as traders can buy into the first pullback with a high probability of a continuation in price.
Why is this key trading tip so important?
Because picking bottoms and tops are risky business, and in most cases, we miss them. Thus, we need to know when the next best time to enter this asset is – buy the dip/first pullback!
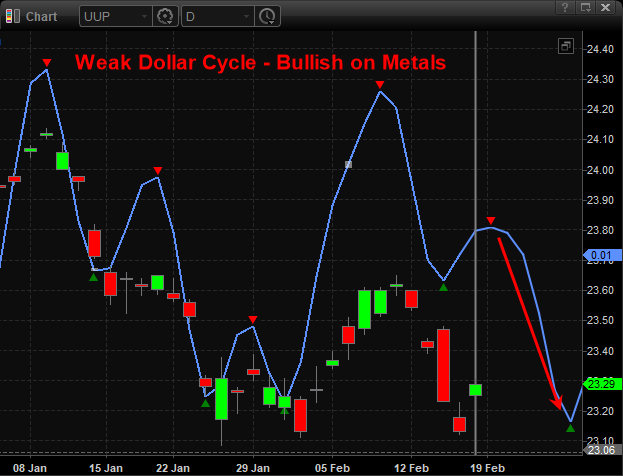
Trading Technical Analysis – US Dollar Index Cycle Bias
The blue lines on the chart is a blend of the most active price cycles for the dollar. As you can see the price is expected to move higher over the next 1-3 days, then be under pressure again. When the dollar falls in value, it helps lift the price of gold and gold-related assets like gold stocks.
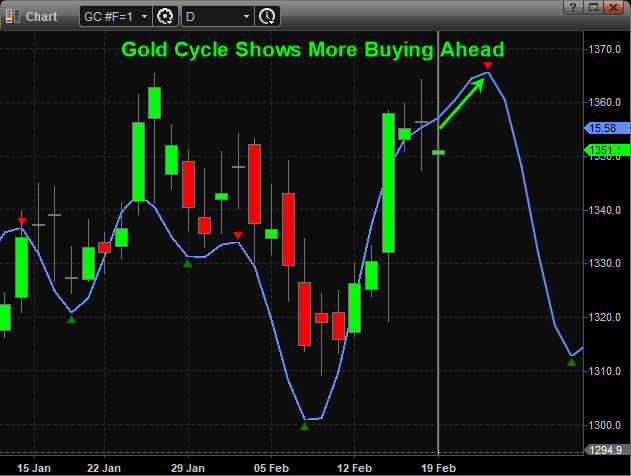
Gold Cycle Analysis
Cycle analysis points to higher prices for a few days, but the upside for gold looks fairly limited as its struggling at recent highs (resistance). But as long as gold holds value or grinds higher it should help lift gold stocks higher.
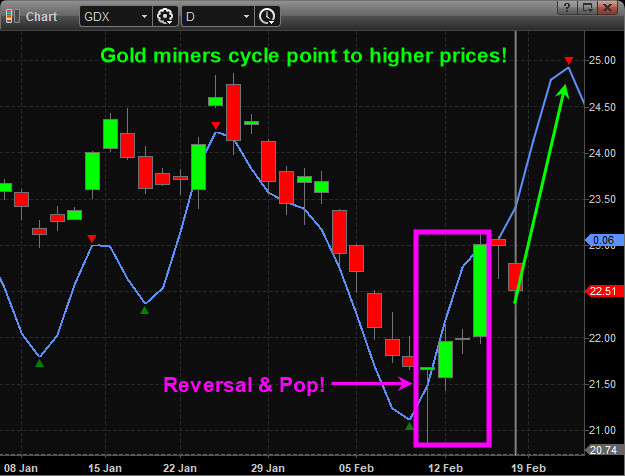
Gold Miners Reversal, Pop, and Cycle Analysis
This daily chart of GDX gold miners shows a big reversal and pop in price. This sets the stage for a second leg higher once the first pullback in price reaches a buy trigger zone.
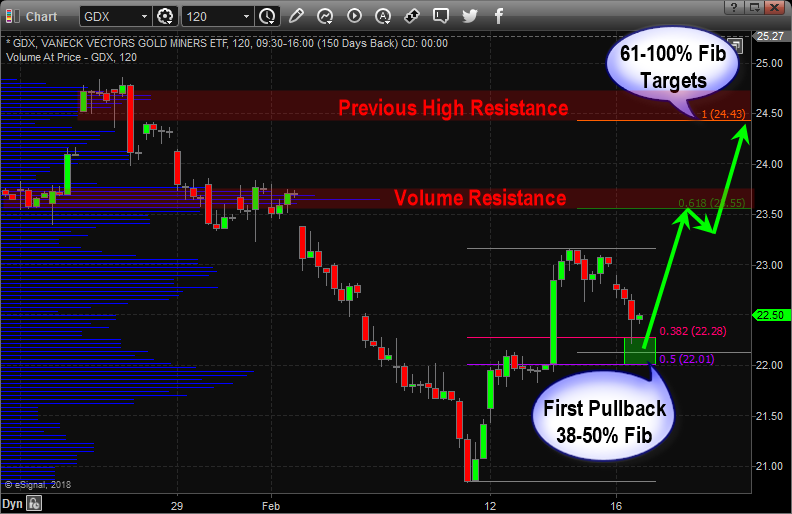
GDX 120 minute (2hr chart) Trading Technical Analysis
If you don’t know or understand Fibonacci retracements of 38-50%, or Fibonacci extensions of 61% and 100%, then the lines on the chart below will not make much sense to you. So, let sum things up quickly.
When price retraces (pulls back) 38% – 50% of a recent rally that is where price usually finds support. This is seen on the chart via the green box buy zone.
Once price reaches that buy zone we can then use Fibonacci extensions of 61% and 100% which uses the previous low down at $21 and rally up to $23 as the upside potential from the green box. Price should find minor resistance at the 61% level, and if a pause or pullback takes place at 61%, then 100% target should be reached as well.
On the chart, I have also added the two red resistance levels which happen to fall near our 61% and 100% targets. While this may seem like a coincidence, believe it or not, the more you study and learn to trade technical analysis you will notice the markets are not that random at all!
Conclusion
In short, the momentum behind gold mining stocks along with the technical analysis points to higher prices in the week ahead. Nothing in the financial markets are 100% certain, so this may not play out as we expect, but this is how I have been trading technical analysis for 21 years. If you have proper position sizing, risk management, and timely setups like what you see here, you can make a lot of money over time.
*********
If you want to watch my live technical analysis videos each morning before the opening bell, so you know what to expect in the coming session and week ahead join my Technical Traders Stock and ETF Trading Wealth Building Newsletter right now!
My articles, Technical Trading Mastery book, and 3 Hour Trading Video Course are designed for both traders and investors to explore the tools and techniques that discretionary and algorithmic traders need to profit in today’s competitive markets. Created with the serious trader and investor in mind – whether beginner or professional – our approach will put you on the path to win. Understanding market structure, trend identification, cycle analysis, volatility, volume, when and when to trade, position management, and how to put it all together so that you have a winning edge.
Chris Vermeulen
Founder of Technical Traders Ltd.

Chris Vermeulen has been involved in the markets since 1997 and is the founder of Technical Traders Ltd. He is an internationally recognized technical analyst, trader, and is the author of the book: 7 Steps to Win With Logic
Through years of research, trading and helping individual traders around the world. He learned that many traders have great trading ideas, but they lack one thing, they struggle to execute trades in a systematic way for consistent results. Chris helps educate traders with a three-hour video course that can change your trading results for the better.
His mission is to help his clients boost their trading performance while reducing market exposure and portfolio volatility.
He is a regular speaker on HoweStreet.com, and the FinancialSurvivorNetwork radio shows. Chris was also featured on the cover of AmalgaTrader Magazine, and contributes articles to several financial hubs like MoneyShow.com.


