Impact Of The Market Crash On The Precious Metals Sector


Whilst we are in complete agreement with Egon Von Greyerz of GoldSwitzerland, about the exceptionally positive mid and long-term outlook for gold and silver which will soar as the monstrous global debt bubble implodes, there is the small matter of what will happen to them when the debt junkies go “cold turkey” if there is a sudden liquidity lockup, such as we have seen start to happen in the repo market in recent weeks, requiring emergency intervention by the Fed. If this happens and the Fed doesn’t immediately roll out QE4, or if it does and the sticking plaster doesn’t hold, then markets could crash very fast, on account of the huge margin leverage which will trigger wave after wave of margin calls, and in this situation investors and speculators will be dumping everything over the side indiscriminately, as in 2008 only this time much worse, and just as gold and silver weren’t spared back then, they probably won’t be this time either.
I say all this because the stockmarket is now set up to crash, with the same kind of yield spread that we saw before markets caved in in 2000 and 2008, and also because gold now appears to be completing a potential Head-and-Shoulders top with an extremely lopsided COT structure and the Commercials heavily short.
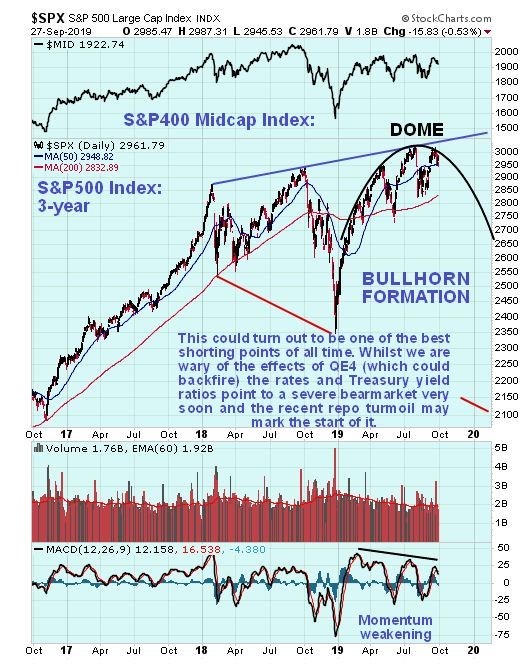
We’ll start our roundup of the charts with a quick look at the updated 3-year chart for the S&P500 Index on which we see a potential massive bullhorn top completing with the index laboring beneath a clear and important line of resistance. A few days ago we took a good look at the 3-year chart for the S&P500 index on which we observed an increasingly tight technical setup calling for a big move soon, but could not make a decisive call because what happens depends on if and when the Fed does QE4, and the chart reflects this ambiguity, which is why it could break in either direction. As we have observed the less watched but important S&P400 Mid-cap and Russell 2000 indices looks considerably worse.
Although the margin debt ratio has eased somewhat in recent weeks, margin leverage is still historically at massive levels…

Click on chart to popup a larger, clearer version.
Chart courtesy of advisorperspectives.com
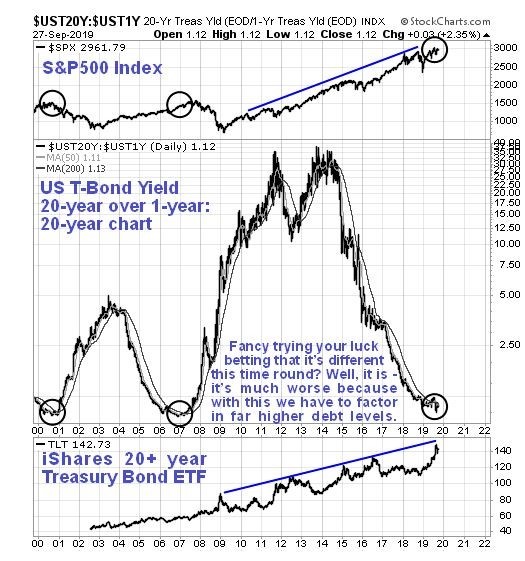
Since Thursday’s article was posted I have given further consideration to the yield spread between long and short-dated Treasuries, which is at the same sort of very low levels that prevailed in 2000 ahead of the dot.com crash and in 2007 ahead of the 2008 crash. To assume that somehow it will be different this time is viewed as foolhardy and dangerous – actually it is different in that it is much worse now as debts are vastly higher. What this means is that we may be in for a rates shock soon that will crash the markets. You can see this with dramatic clarity on the 20-year chart for the ratio of the yield between the 1-year and 20-year Treasuries shown below – it looks like a very similar ratio and setup to what existed back in 2000 and again in 2007. It’s much more serious this time round however due to the enormous growth in debt and margin usage over the past 10 years - if or rather when the wheel comes off this time round, it will quickly become a much more dangerous and desperate situation because there is no buffer and no fallback position. Rates are so low that they can scarcely be lowered and debt is already at horrendous extremes. The only recourse will be money printing on an unprecedented scale – QE4 – which this time is likely to crash the dollar, choking off any funds that might otherwise be attracted from overseas investors.
The impeachment of Trump, which is looking increasingly likely, is another negative factor for the markets, because of the political paralysis it will entail. The Deep State has been working to bring down Trump since even before he swore the oath of office, and after their Russiagate hoax ended up on the rocks, they have had to come up with another reason to get him thrown out. It is a singular obsession of the wholly unprincipled Democratic party which instead of working in a bipartisan manner for the good of the country fixates on kicking Trump out of office. The Deep State’s message to the ordinary citizen could not be clearer – “Vote for who you like, but WE decide who runs the country.”
Thus, even though the Big Picture outlook for gold and silver could not be better, we have to ask ourselves what will happen to them in the event of an all-out broad-based market panic, exacerbated by wave after wave of big margin calls, and we have to look at the latest charts for the sector and COTs with this in mind.
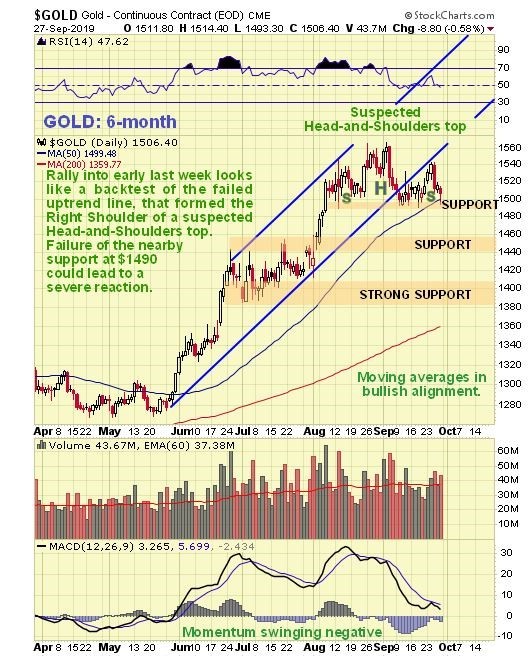
An ugly development across the sector last week was the failure of the rally of the past week or two, with a quite sharp reversal occurring at resistance, and on the 6-month gold chart it now looks like it is completing a Head-and-Shoulders top above a line of support at $1490, with the price currently finding support at the rising 50-day moving average. If this support level at about $1490 fails, then we could see a sudden and severe decline, and such a drop would of course be most likely to occur against the background of a plunging stockmarket.
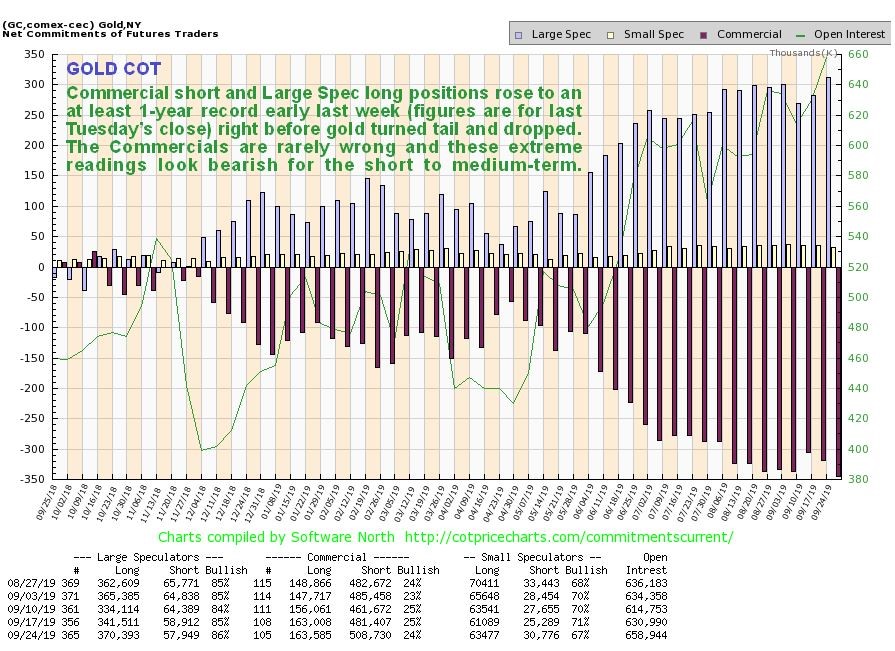
Making a severe reaction by gold soon more likely is its latest COT chart, which shows that the Commercials have an at least 1-year record short position, and since they always come out on top in the end, this is clearly not a good omen for the short to medium-term. We have been mindful of this in the recent past, but with an awareness that positions could get even more extreme, and they did.
Click on chart to popup a larger, clearer version.
Just how extreme are the COT / Hedgers charts for gold historically? On our latest Hedgers chart we see that they are at their most extreme levels for at least 30-years, and we can surmise from this that if we see a broad-based market crash soon, then gold and silver will get taken down hard too, as in 2008, but with the difference that their subsequent recovery will be extraordinarily sharp and strong, since it will likely be in response to QE on a gigantic and unprecedented scale that will in due course result in hyperinflation.

Click on chart to popup a larger, clearer version.
Chart courtesy of sentimentrader.com
To sum up, we now know where to draw our battle lines. As mentioned in the update Market on the Cusp, posted several days ago, the broad market may be shorted (general stocks sold, with exception of some special situations, inverse ETFs and Puts bought etc.) at current levels and especially on any approach to the Dome boundary drawn on our S&P500 index chart, with positions being closed out in the event of the market breaking clear above the upper boundary of the bullhorn pattern. Note that an important difference now is that the downside scenario is ascribed about a 60% probability. With respect to the Precious Metals sector, there are several strategies. One is to stand aside now, before the $1490 level fails because that will lead to a plunge, or buy sufficient Puts to cancel out any losses on your holdings in the event of a steep drop. Leveraged inverse ETFs are another way to insulate against loss, but Puts are preferred because they always move as they should whereas ETFs don’t.
The crucial point is to make sure that in the event of a PM sector rout caused by a market crash, you are in position to move in and mop up the incredible bargains that will abound at that time, because the subsequent gains are likely to be incredible, and if you can leverage them even more by, say, placing a percentage of your available funds into something like GLD Calls, you are likely to make truly life changing gains in short order.
*********

Clive P. Maund’s interest in markets started when, as an aimless youth searching for direction in his mid-20’s, he inherited some money. Unfortunately it was not enough to live a utopian lifestyle as a playboy or retire very young. Therefore on the advice of his brother, he bought a load of British Petroleum stock, which promptly went up 20% in the space of a few weeks. Clive sold them at the top…which really fired his imagination. The prospect of being able to buy securities and sell them later at a higher price, and make money for doing little or no work was most attractive – and so the quest began, especially as he had been further stoked up by watching from the sidelines with a mixture of fascination and envy as fortunes were made in the roaring gold and silver bull market of the late 70’s.
Clive furthered his education in Technical Analysis or charting by ordering various good books from the US and by applying what he learned at work on an everyday basis. He also obtained the UK Society of Technical Analysts’ Diploma.
The years following 2005 saw the boom phase of the Gold and Silver bull market, until they peaked in late 2011. While there is ongoing debate about whether that was the final high, it is not believed to be because of the continuing global debasement of fiat currency. The bear market since 2011 is viewed as being very similar to the 2-year reaction in the mid-70’s, which was preceded by a powerful advance and was followed by a gigantic parabolic price ramp. Moreover, Precious Metals should come back into their own when the various asset bubbles elsewhere burst, which looks set to happen anytime soon.
Visit Clive at his website: CliveMaund.com


