Inverse Head And Shoulders In The Miners (GDX)? Really?


Gold rallied, silver rallied, and mining stocks rallied. That’s how one can summarize yesterday’s session. The volume was huge, so it appears that a major upswing has just begun. But is this really the case? As always, just because things look encouraging and the emotions are high, it doesn’t mean that anything changed. One needs to step back from the day-to-day price and volume changes and look at the factors that are in place right now without any biases. No hopes, no “feelings toward the market”, and no worries about missing the boat. Just facts and logic. Let’s start with gold (charts courtesy of http://stockcharts.com).
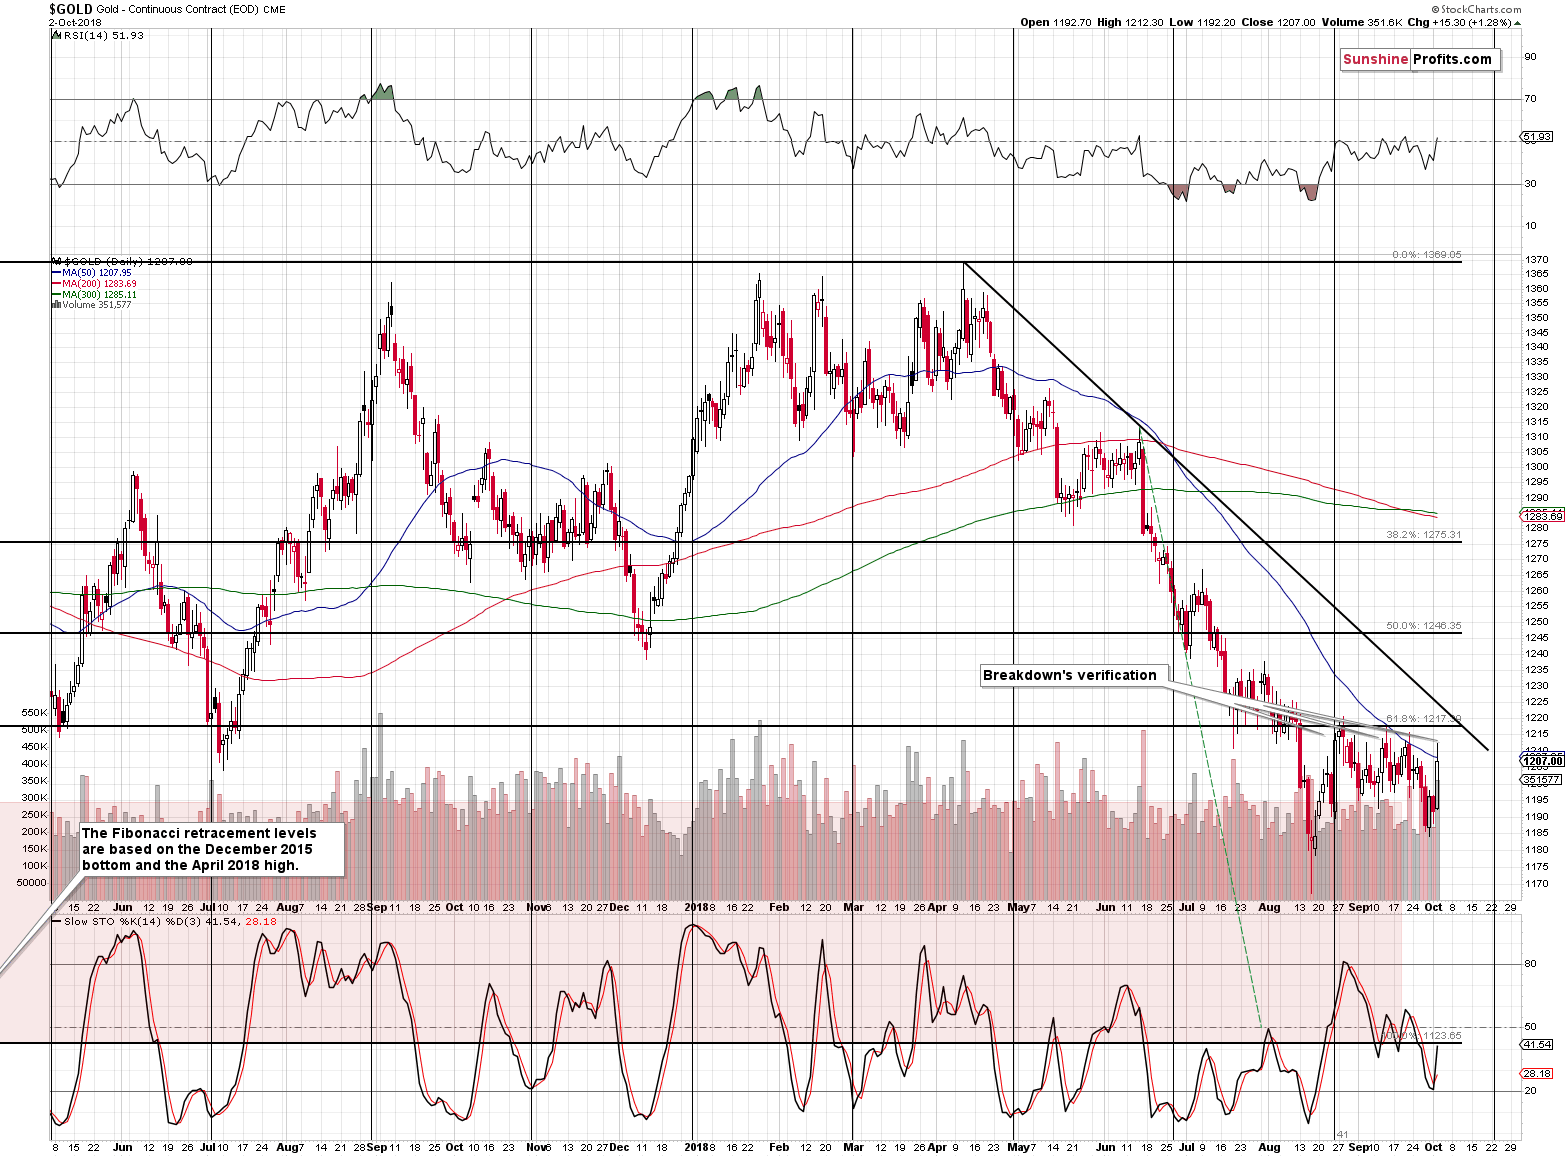
Gold moved higher and the volume was significant. Right. But, what does it change? Did the price increase to the levels that imply a change? Was there an important breakout? Did we see an invalidation of a breakdown? No. Nothing like that happened. Gold moved temporarily above its 50-day moving average and it didn’t even move to its late-August highs.
The price action didn’t change anything. But maybe the size of the volume did? Nope. Price increase on big volume that takes place during a consolidation pattern quite often marks the end of the consolidation… And declines. Mid-April top (which was the 2018 top in terms of the intraday prices) was accompanied by huge volume and we saw big volume levels at practically every daily rally that preceded the big declines. The volume spikes (considering only those that took place when gold moved higher) that we saw in the second half of May, the mid-June one, and early-July one suggest that what we saw yesterday might actually be viewed as a bearish sign. Some may argue that it’s too far-fetched, and even if you choose to think that it is, it’s definitely enough to prove (!) that yesterday’s big-volume upswing was not bullish.
But gold rallied along with the USD Index!
It did, and that’s mostly interesting because of the decline in the EUR/USD exchange rate. But, is this really something major? Did it change a lot? The best way to check is to examine gold’s price in terms of the euro.
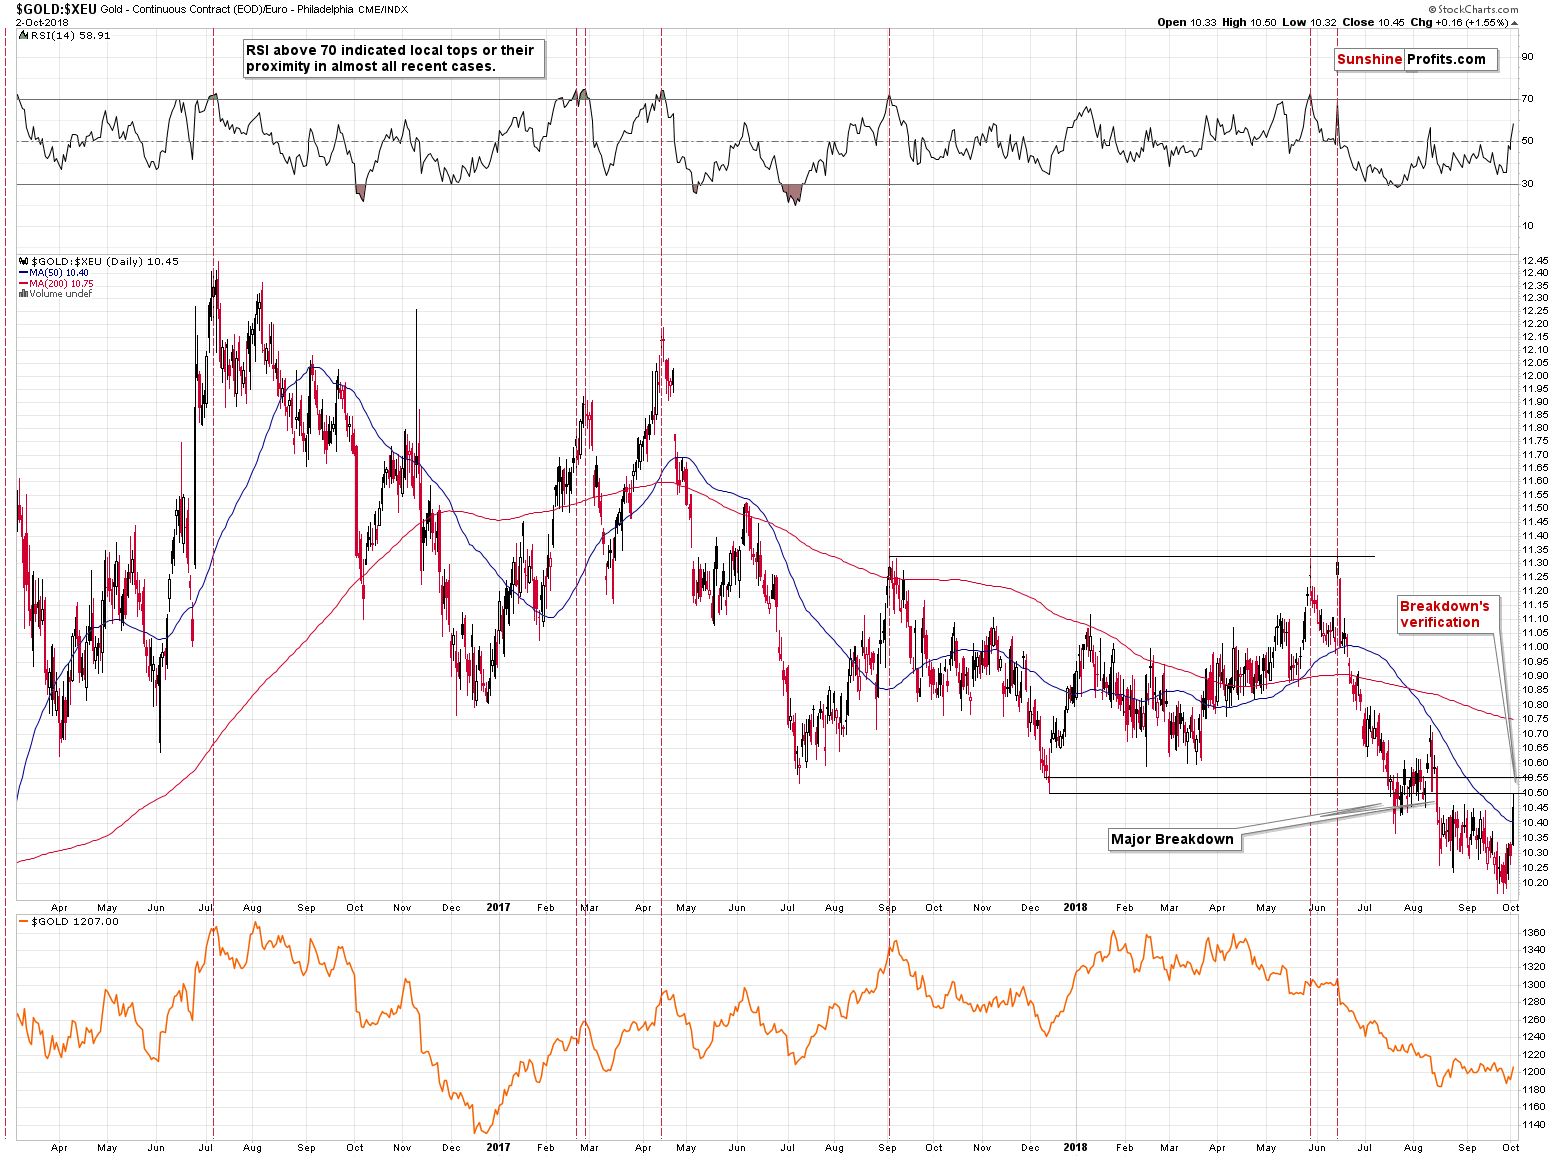
The above chart shows two important facts:
1. Gold moved back to its previous support level, which now turned into resistance and it didn’t invalidate the breakdown. This means that the situation is bearish as the upside appears tiny, while the downside is still huge.
2. The previous two sharp upswings (mid-June 2018, early-August 2018) in gold in terms of the euro were exactly what marked the starting points of big declines in terms of both: euro and the USD.
The implications are therefore bearish. Once again, some may say that it’s too far-fetched and no rally should be viewed as bearish and even if you choose to believe it, it doesn’t change the fact that the above proves that yesterday’s action was not bullish.
But miners soared! There is a clear inverse head-and-shoulders pattern in the GDX, and a bearish H&S in DUST.
First of all, there should be absolutely no technical analysis of assets that inherently have to provide fake signals. This includes DUST, NUGT, JDST, JNUG, and other significantly leveraged instruments that have inherent time decay (their value decreases over time if nothing happens to the price of the underlying asset).
If you had a gun that you knew shoots below the target each time, but it was off by various amounts, would you aim right at the target to hit the bullseye? No. You would know that’s pointless (I’m sure you’ll find an even better word for it) and you’d choose a gun that hits what you’re aiming at.
The values of the above-mentioned ETNs are not only based on the price changes in the underlying assets but also based on the time decay. It doesn’t matter that much in the price moves by a lot in a relatively short timeframe, but it does matter a lot when it comes to detecting price patterns and discussing whether it’s reliable or not.
One may want to look at the market from different angles to spot divergences that would provide the edge – something that other investors missed and that could be used to enter better positions ahead of the others. For instance, looking at ratios such as the one between gold stocks and the general stock market, is one of the ways in which we apply this technique.
But you have to know what you’re looking at! In case of the leveraged ETNs, the only source of divergence can be what’s not based on the market performance. Discovering a price difference between a leveraged ETN and the price of the underlying asset (here: mining stocks or unleveraged mining stock ETFs like GDX) is not a market divergence – it’s a reflection of the cost structure of the instrument that you’re looking at. It has no analytical or predictive value.
Basing investment decisions on leveraged ETNs’ analysis is like looking at the above-mentioned broken gun analyzing how it missed the target and thinking “ooh, so now the guns are starting to shoot lower than they used to, I better shoot below the target from now on with all my guns”.
If you see anyone providing signals based on the ETNs instead of using the unleveraged instruments, or – even worse – discussing divergences between the ETNs and unleveraged instruments (like gold, silver or GDX, for example), you might want to reconsider reading the rest of their analyses.
Based on the above, we will not provide you with DUST chart to show the head-and-shoulders pattern, because whatever might be on the DUST chart that’s not present in the unleveraged instruments, is irrelevant.
Consequently, let’s take a look at the GDX ETF.
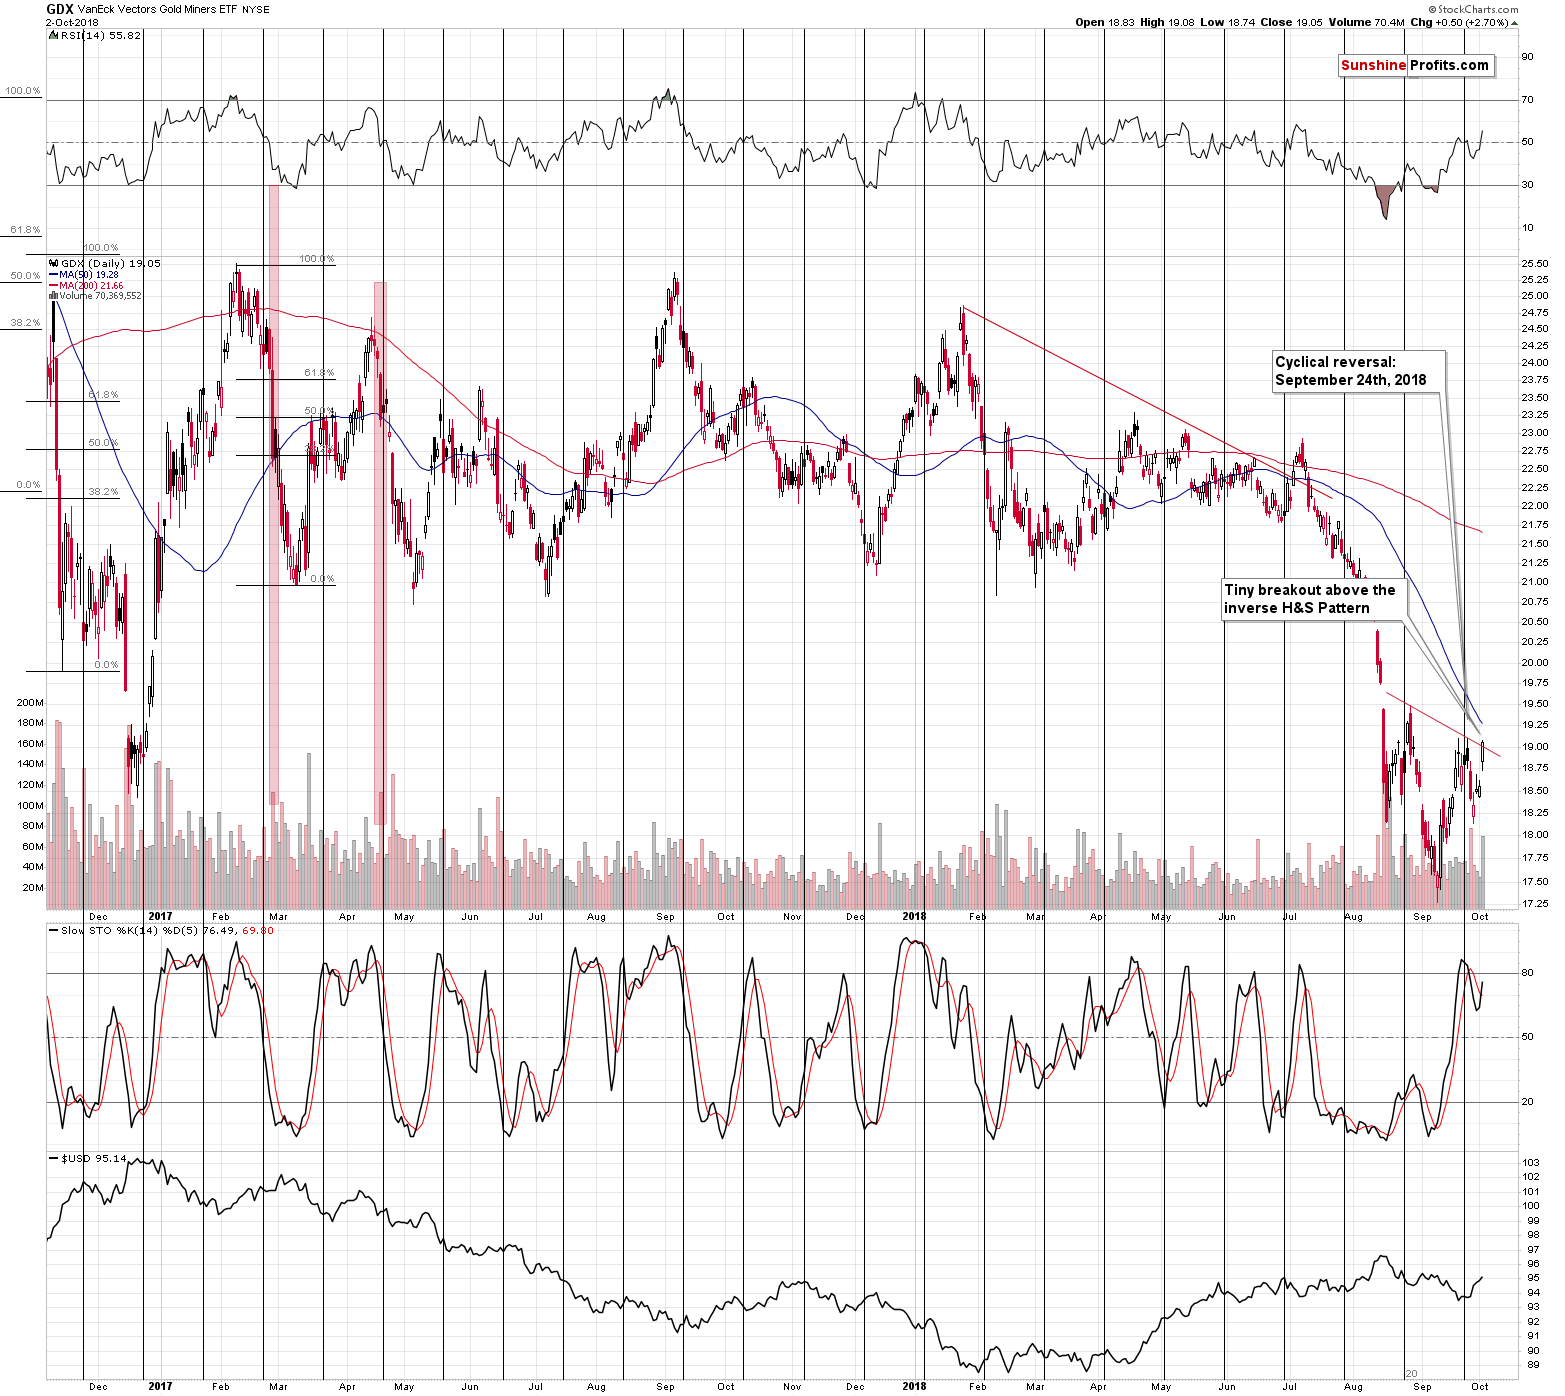
The GDX ETF recently closed at $19.05 and the neck level of the inverse head-and-shoulders pattern is at $19. Since the GDX closed 5 cents above the neck level, we saw a breakout.
A-ha! You said it yourself! A breakout! And breakouts are bullish!
Yes, they are, but if the breakout is so tiny as the one that we saw in GDX yesterday, then it has to be confirmed, before one can really speak of bullish implications. So, sorry, but the outlook didn’t really improve based on the above-mentioned breakout. And since the GDX ETF just moved to the previous highs, there’s really nothing else that we can say about the above chart – not much changed.
But, before moving to silver, let’s consider the fact that the GDX ETF is just one of several proxies for the mining stock sector. Let’s see how the others performed yesterday – maybe there were impressive breakouts above the neck levels in head-and-shoulders patterns somewhere else?
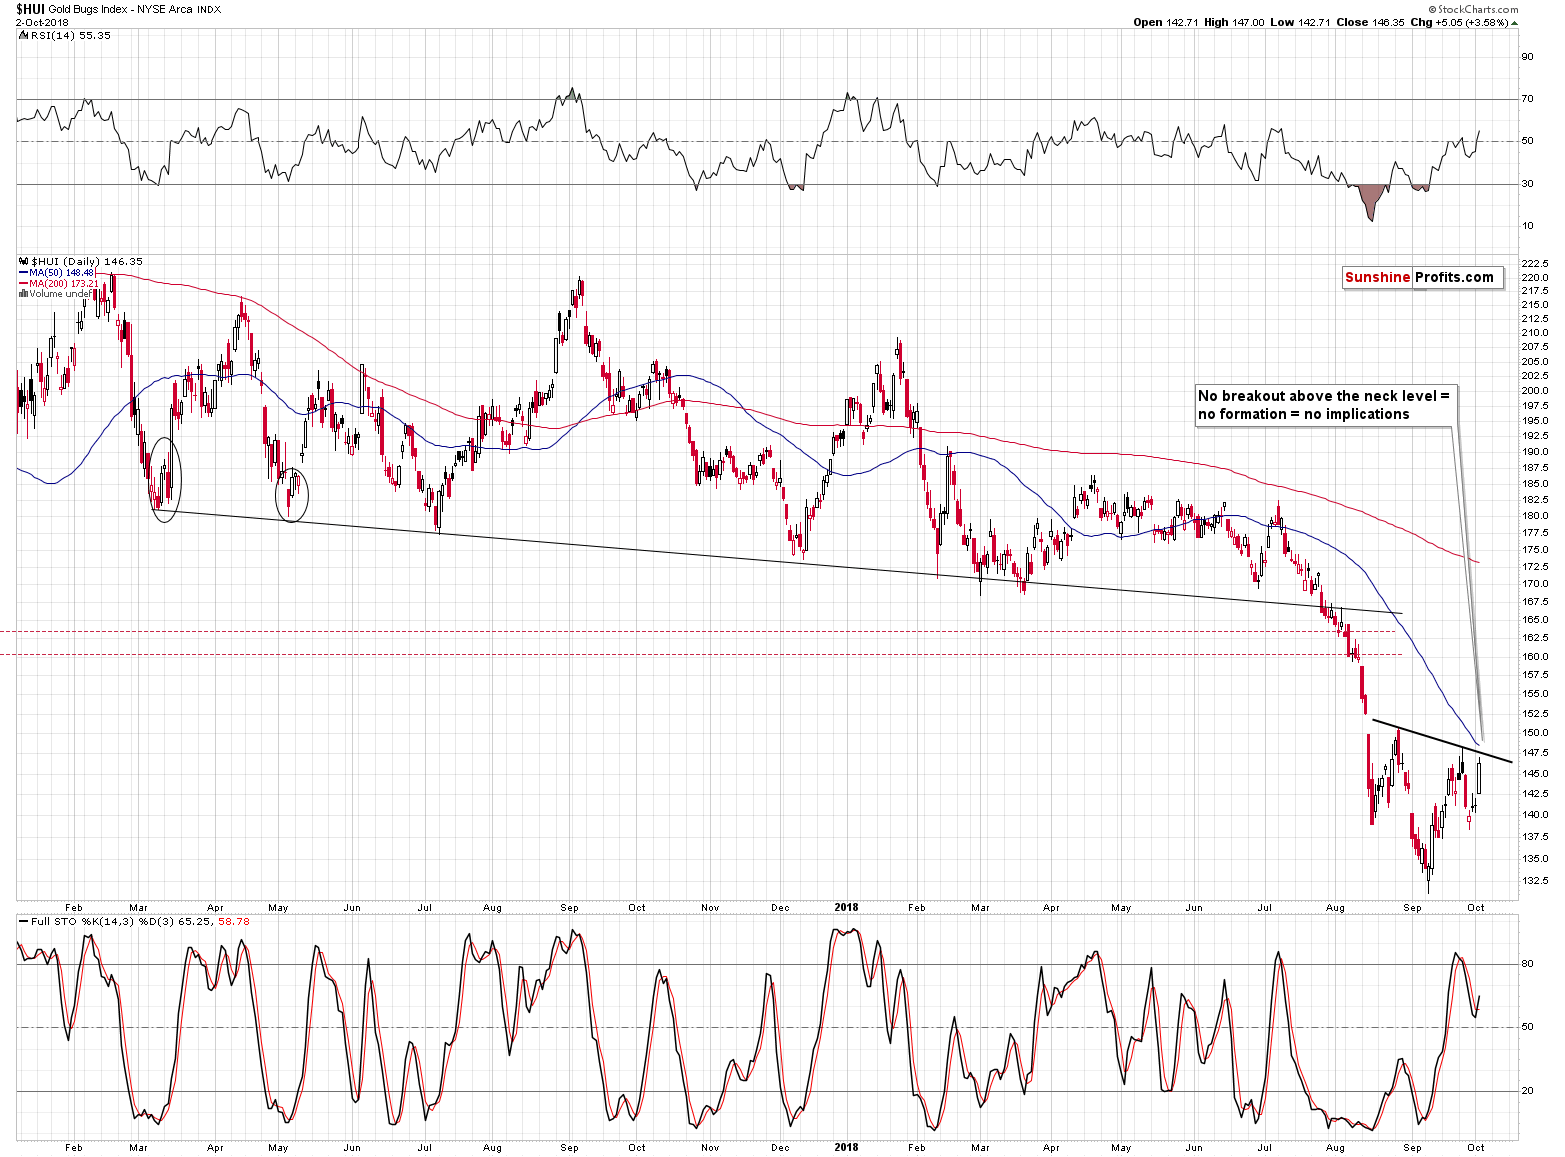
The HUI Index – the most popular index for gold stocks. No breakout.
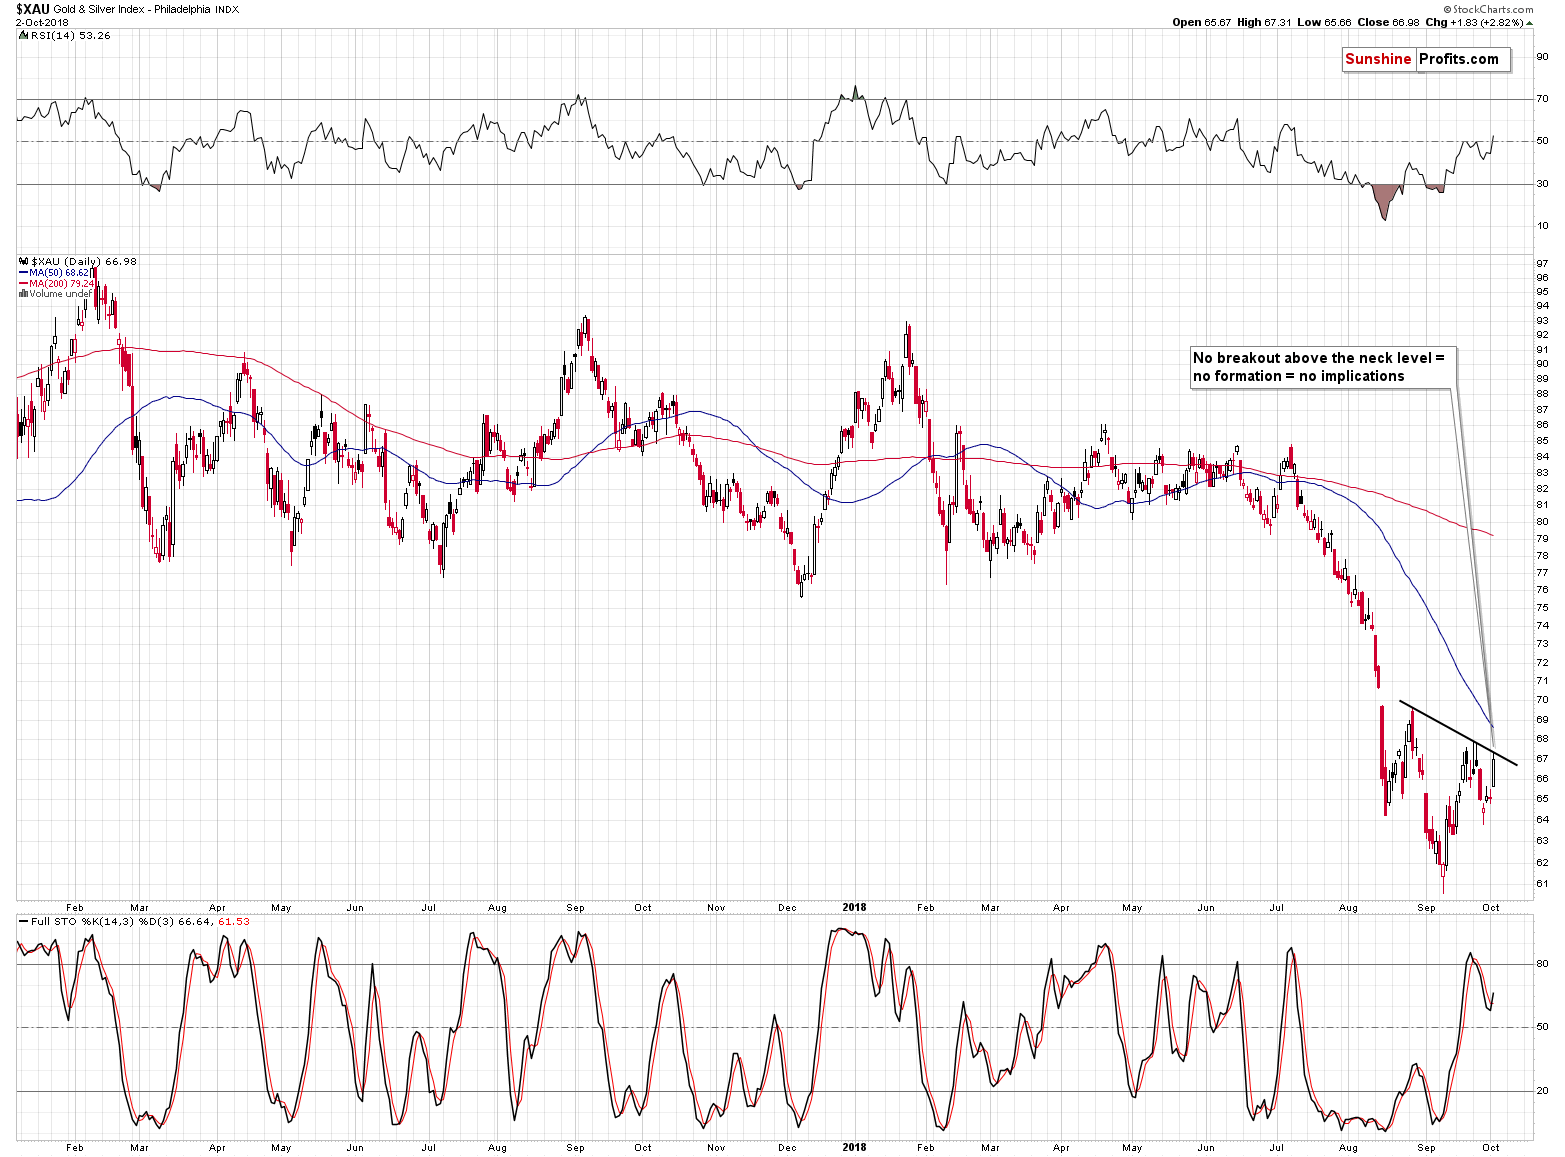
The XAU Index – the index that covers both: gold stocks and silver stocks. No breakout.
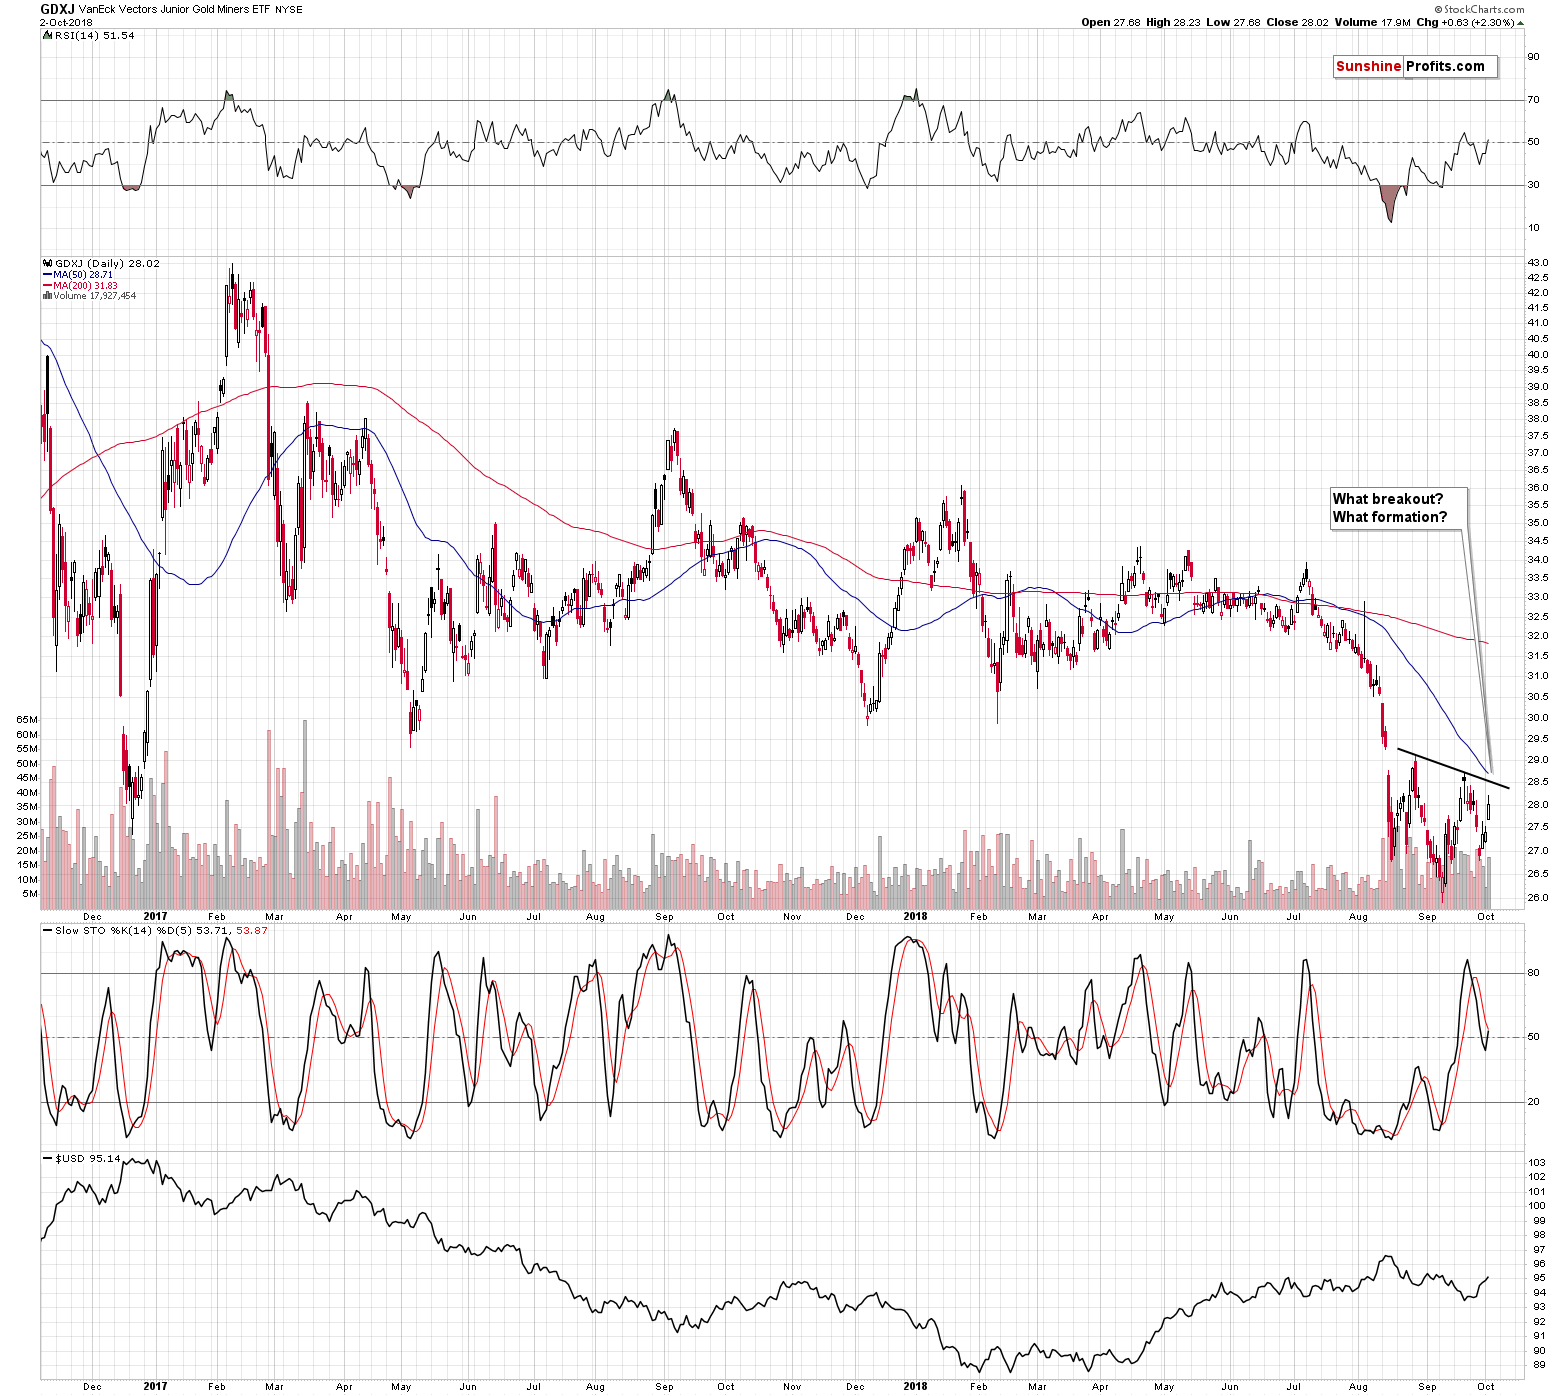
GDXJ – the GDX ETF’s counterpart for junior miners. No breakout.
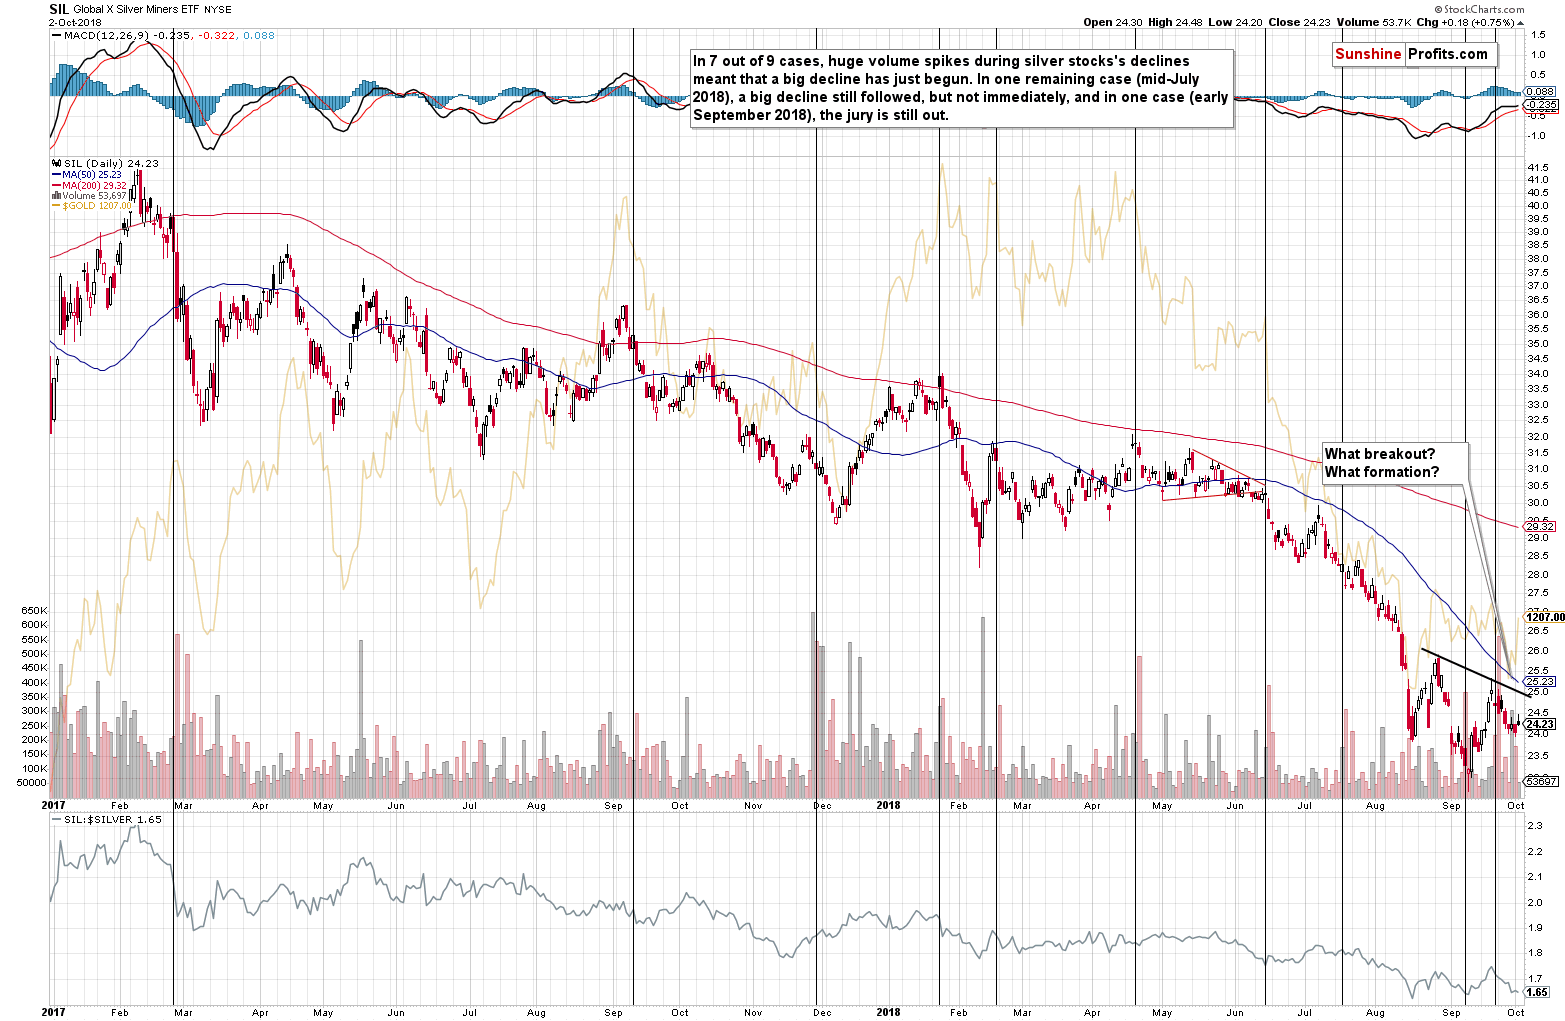
The SIL ETF – the proxy for silver stocks. No breakout; not even close.
Out of all the popular proxies for the mining stocks, we only saw a breakout in the GDX ETF and it was very small. The odds are that it was rather accidental and not the true representation of what’s going on in the market.
In fact, if we look at miners’ performance relative to gold, we can see it as well.
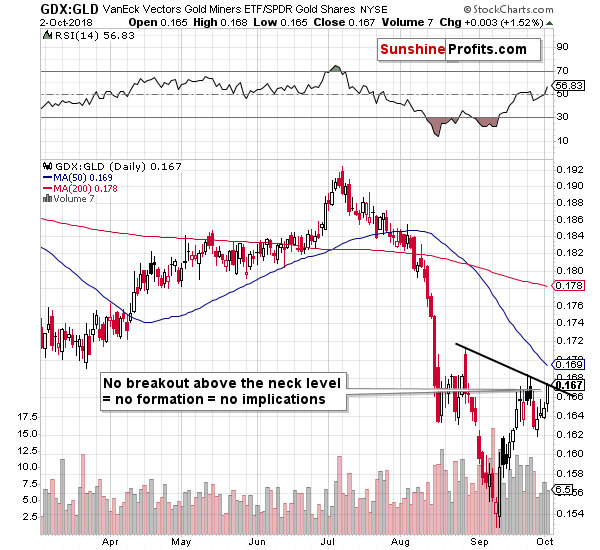
Even the GDX to GLD ratio shows that there was no breakout.
We wrote about the above charts several times in the past, but it’s worth repeating once again, as analysts keep making this mistake even though we explained it over a year ago. An incomplete pattern is no pattern on its own. If it was, it would have a name and its implications would have been widely described. Without a move above the neck level, there simply is no inverse head-and-shoulders pattern. And without a confirmation of the move, there are almost no implications.
Having said that, let’s move silver.
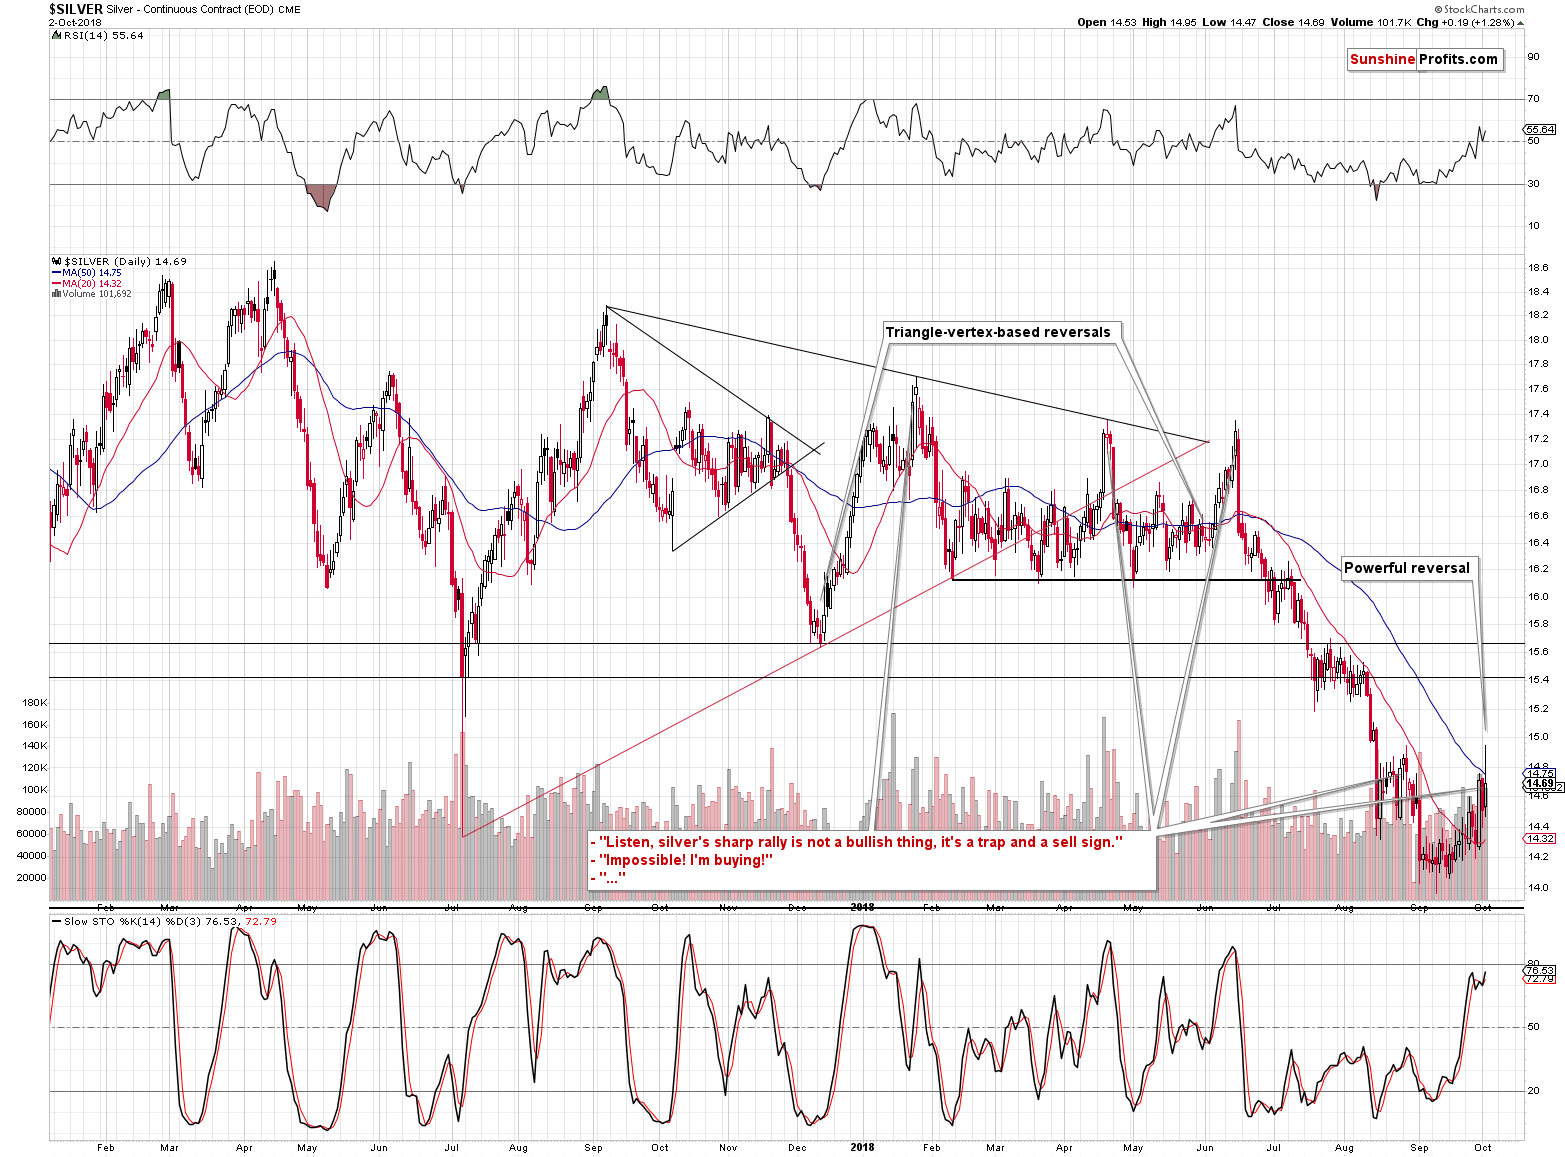
The white metal rallied and on a very short-term basis it outperformed both: gold, and mining stocks. Gold and miners didn’t move to their late-August highs, but silver did. And then it declined, closing a bit below the September 28th closing price. Overall nothing really changed, but at the same time we have once again seen “the silver signal”, when silver outperformed on a very short-term basis.
As always, many investors (as indicated by significant volume) think that this is bullish. We marked several cases, when the SLV ETF rallied on huge volume – they were all the final chances to get on the short side of the market, not the starting points of a new rally.
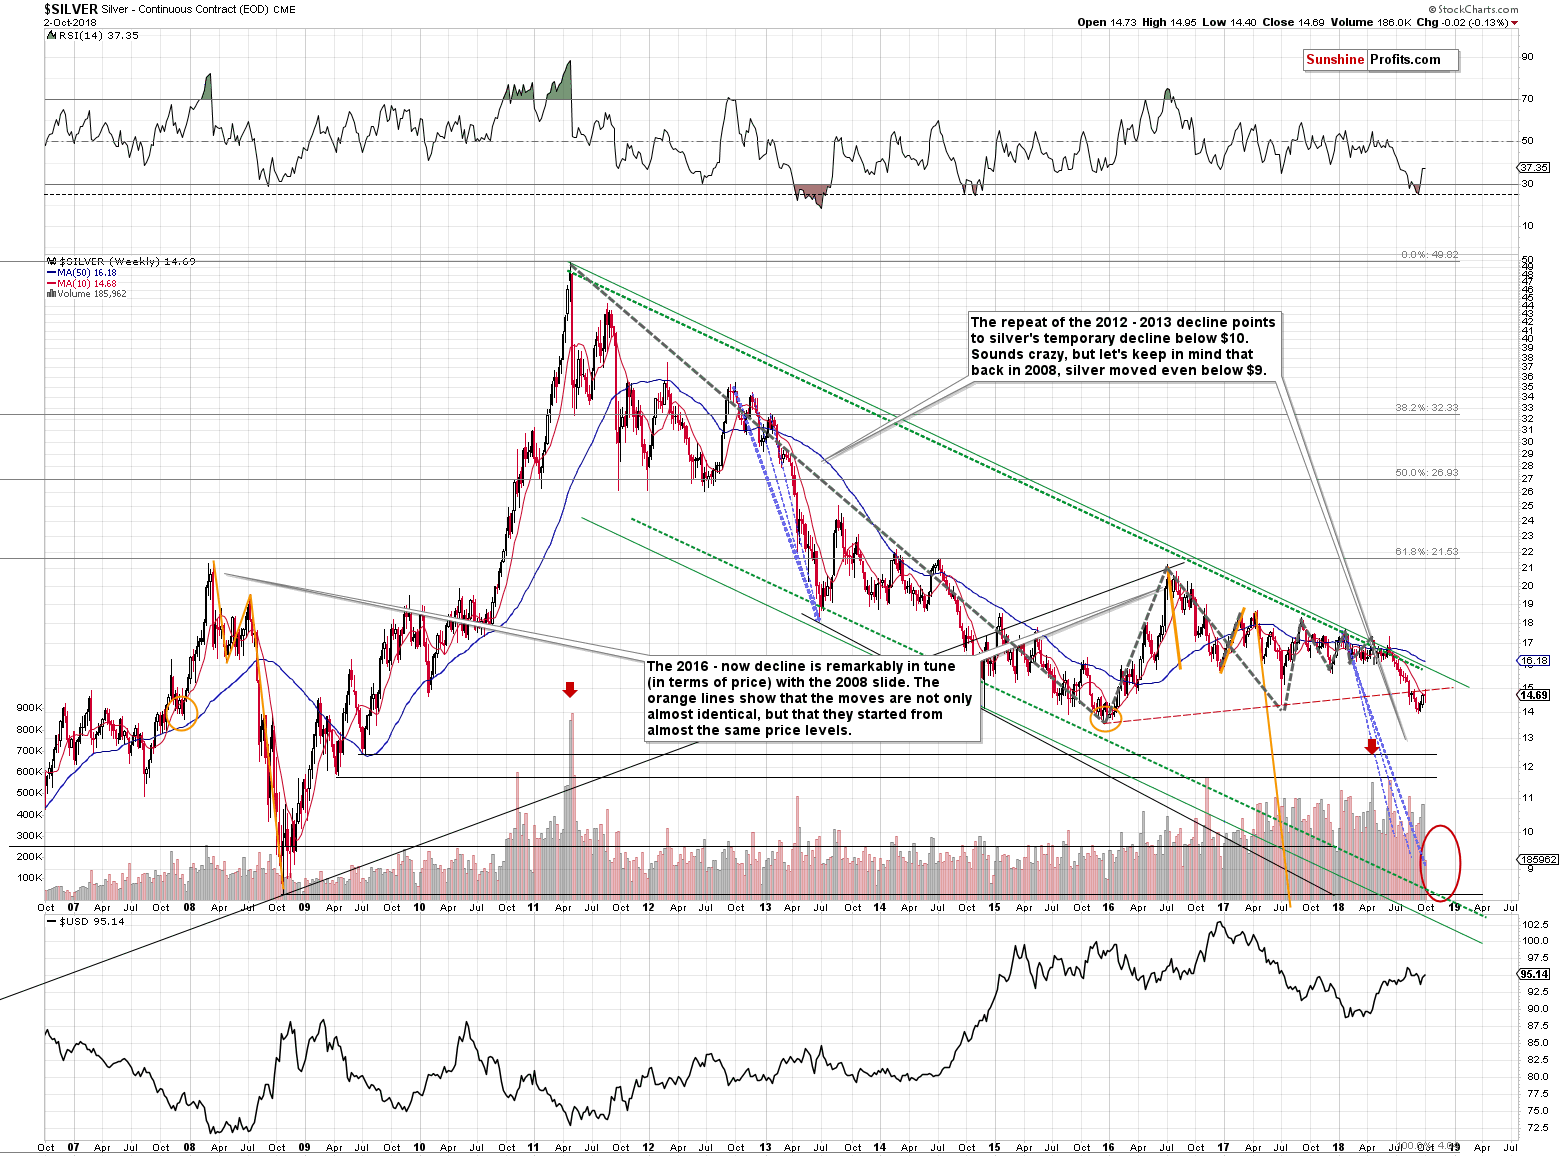
Besides, looking at silver’s very long-term chart makes it clear that the “strength” that we saw recently is nothing more than just a verification of the breakdown below the red dashed line. The verification seems to be completed and the implications remain bearish.
Speaking of long-term breakdowns and verifications, let’s take a look at platinum and gold stocks to other stocks ratio.
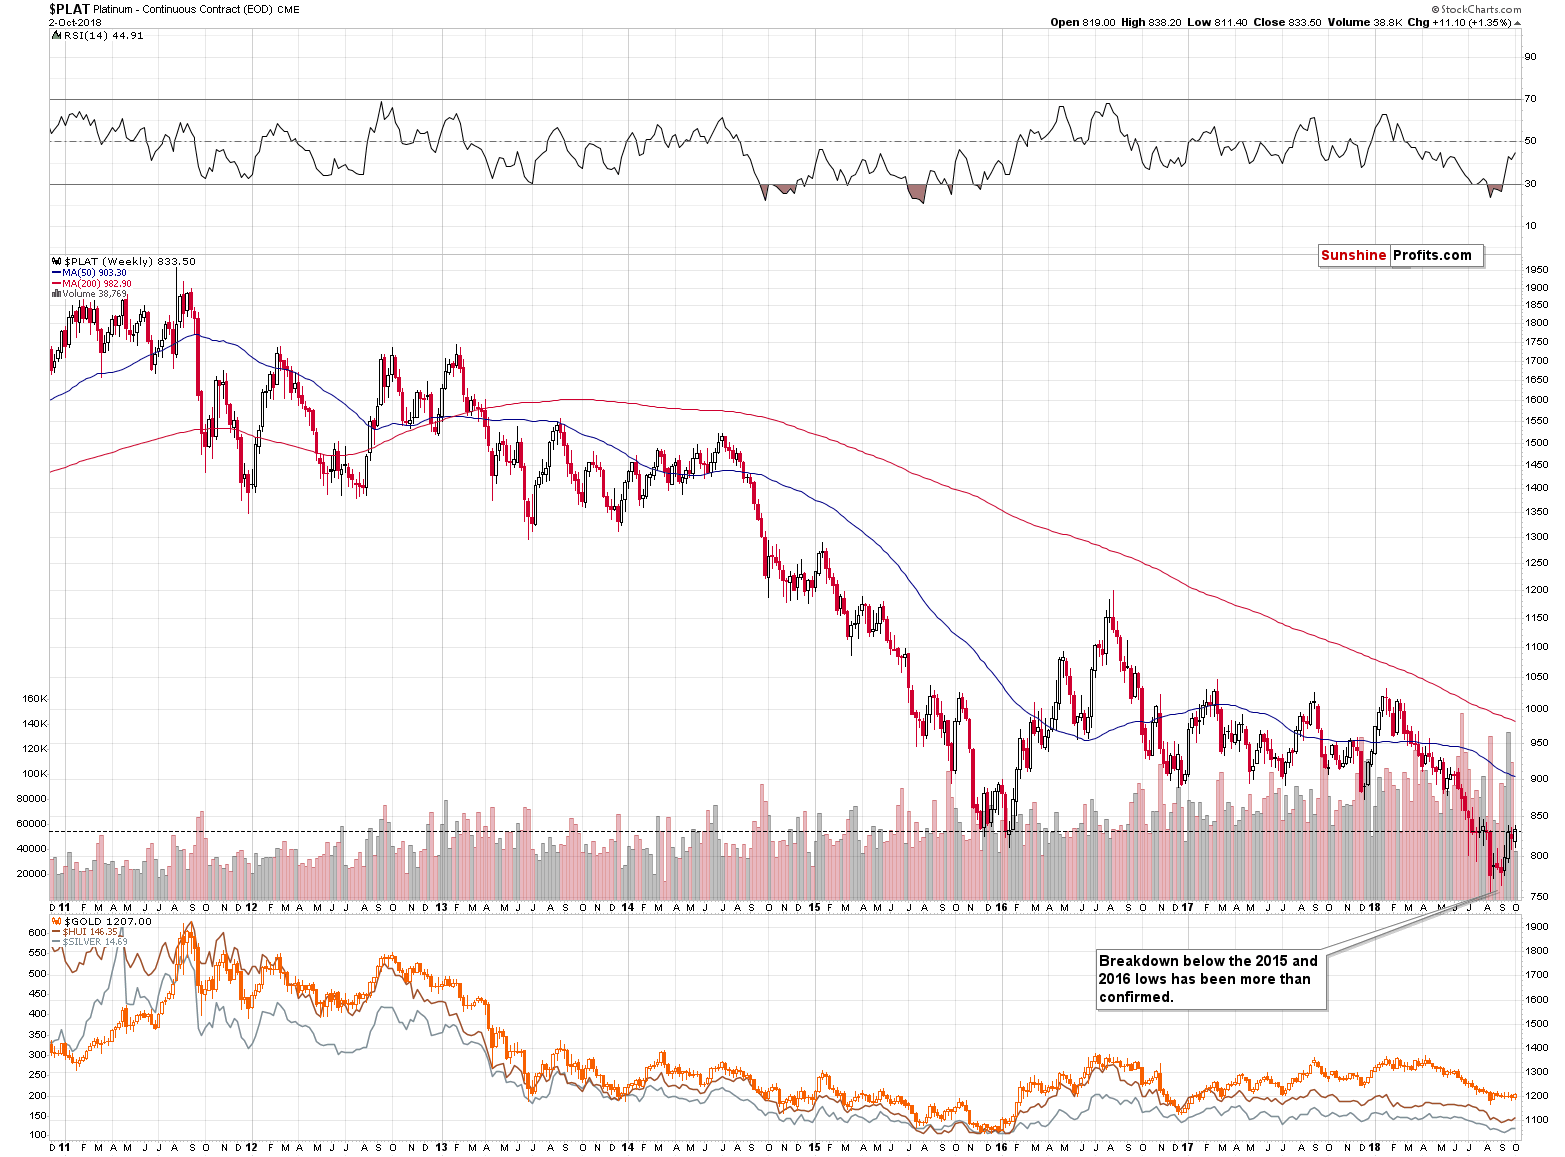
The platinum price is once again verifying the breakdown below the 2016 lows. That’s a breakdown below the long-term support level, so using weekly price levels as decisive ones appears justified. Despite intraday and intraweek attempts, there was no invalidation of the earlier breakdown in terms of the weekly closing prices. The week is far from being over and the platinum price is currently very close to the previous 2016 low. It seems that the upside is very limited and that we’ll see a decline shortly.
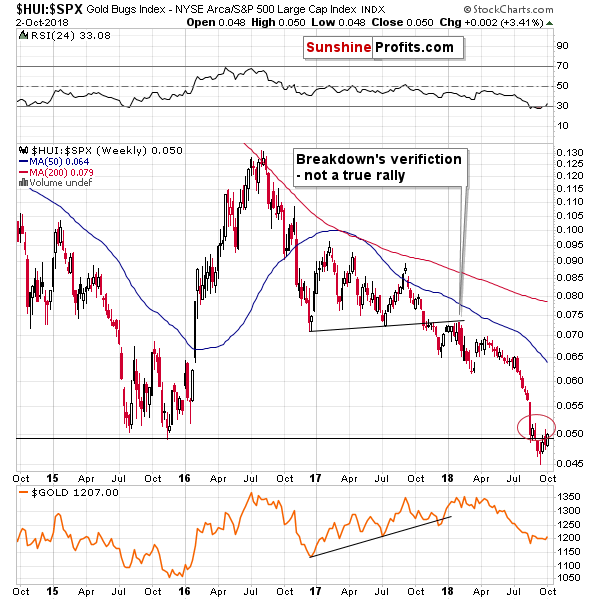
We can say something very similar about the HUI to S&P500 ratio and the breakdown below the 2015 low. The previous attempt to move back above it was invalidated shortly and since the invalidation is not confirmed by weekly closing prices, it appears that something similar is about to take place also in the following days. Perhaps even today.
Summing up, the seemingly bullish implications of the analysis of the inverse head-and-shoulders pattern in mining stocks are too weak to change the overall outlook, especially in light of the new confirmation that we saw from the SLV ETF and its volume. The analogy to 2013 remains in place and the outlook remains strongly bearish.
Przemyslaw Radomski, CFA
Founder, Editor-in-chief, Gold & Silver Fund Manager
Sunshine Profits - Gold & Silver Investment
* * * * *
All essays, research and information found above represent analyses and opinions of Przemyslaw Radomski, CFA and Sunshine Profits' associates only. As such, it may prove wrong and be a subject to change without notice. Opinions and analyses were based on data available to authors of respective essays at the time of writing. Although the information provided above is based on careful research and sources that are believed to be accurate, Przemyslaw Radomski, CFA and his associates do not guarantee the accuracy or thoroughness of the data or information reported. The opinions published above are neither an offer nor a recommendation to purchase or sell any securities. Mr. Radomski is not a Registered Securities Advisor. By reading Przemyslaw Radomski's, CFA reports you fully agree that he will not be held responsible or liable for any decisions you make regarding any information provided in these reports. Investing, trading and speculation in any financial markets may involve high risk of loss. Przemyslaw Radomski, CFA, Sunshine Profits' employees and affiliates as well as members of their families may have a short or long position in any securities, including those mentioned in any of the reports or essays, and may make additional purchases and/or sales of those securities without notice.
 Przemyslaw Radomski, CFA, is the founder, owner and the main editor of SunshineProfits.com. You can reach Przemyslaw at: http://www.sunshineprofits.com/help/contact-us/.


